Copyright
©The Author(s) 2024.
World J Gastrointest Oncol. Jun 15, 2024; 16(6): 2463-2475
Published online Jun 15, 2024. doi: 10.4251/wjgo.v16.i6.2463
Published online Jun 15, 2024. doi: 10.4251/wjgo.v16.i6.2463
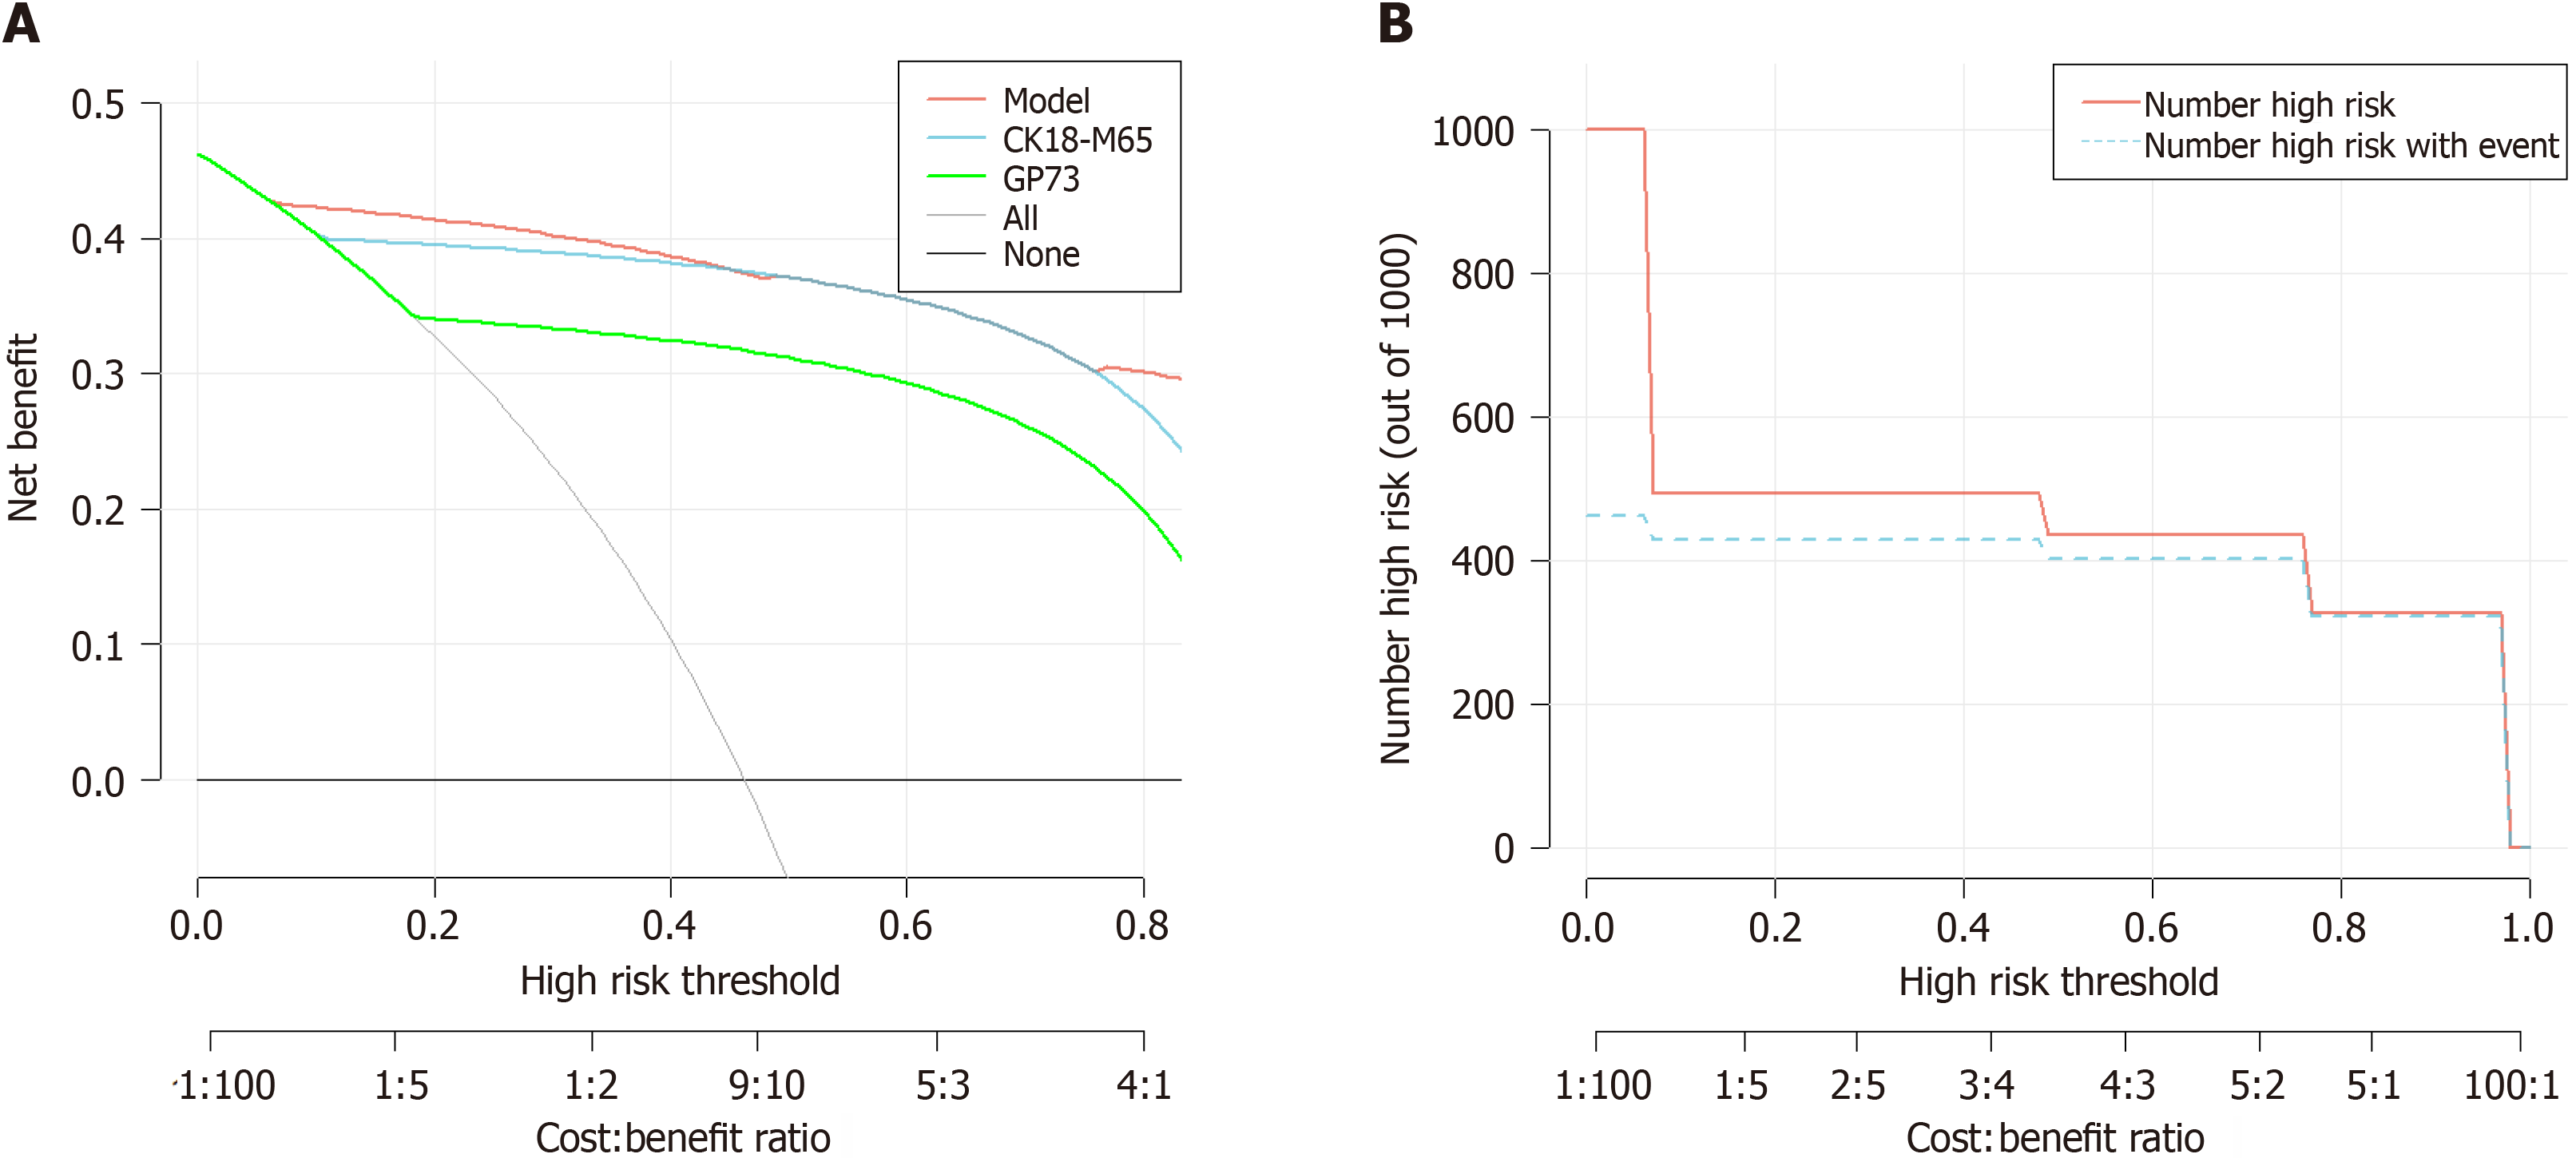
Figure 6 Performance assessment of the nomogram.
A: Decision curve analysis for hepatocellular carcinoma patients. Black line: All patients had the disease. Grey line: Patients with no disease. Red line: Model from the column chart; blue line: CK18-M65; green line: GP73; B: Clinical impact curve analysis. Dashed blue line: Number of disease cases in the high-risk population. Red line: High-risk population.
- Citation: He L, Zhang C, Liu LL, Huang LP, Lu WJ, Zhang YY, Zou DY, Wang YF, Zhang Q, Yang XL. Development of a diagnostic nomogram for alpha-fetoprotein-negative hepatocellular carcinoma based on serological biomarkers. World J Gastrointest Oncol 2024; 16(6): 2463-2475
- URL: https://www.wjgnet.com/1948-5204/full/v16/i6/2463.htm
- DOI: https://dx.doi.org/10.4251/wjgo.v16.i6.2463


