Copyright
©The Author(s) 2024.
World J Gastrointest Oncol. May 15, 2024; 16(5): 2225-2232
Published online May 15, 2024. doi: 10.4251/wjgo.v16.i5.2225
Published online May 15, 2024. doi: 10.4251/wjgo.v16.i5.2225
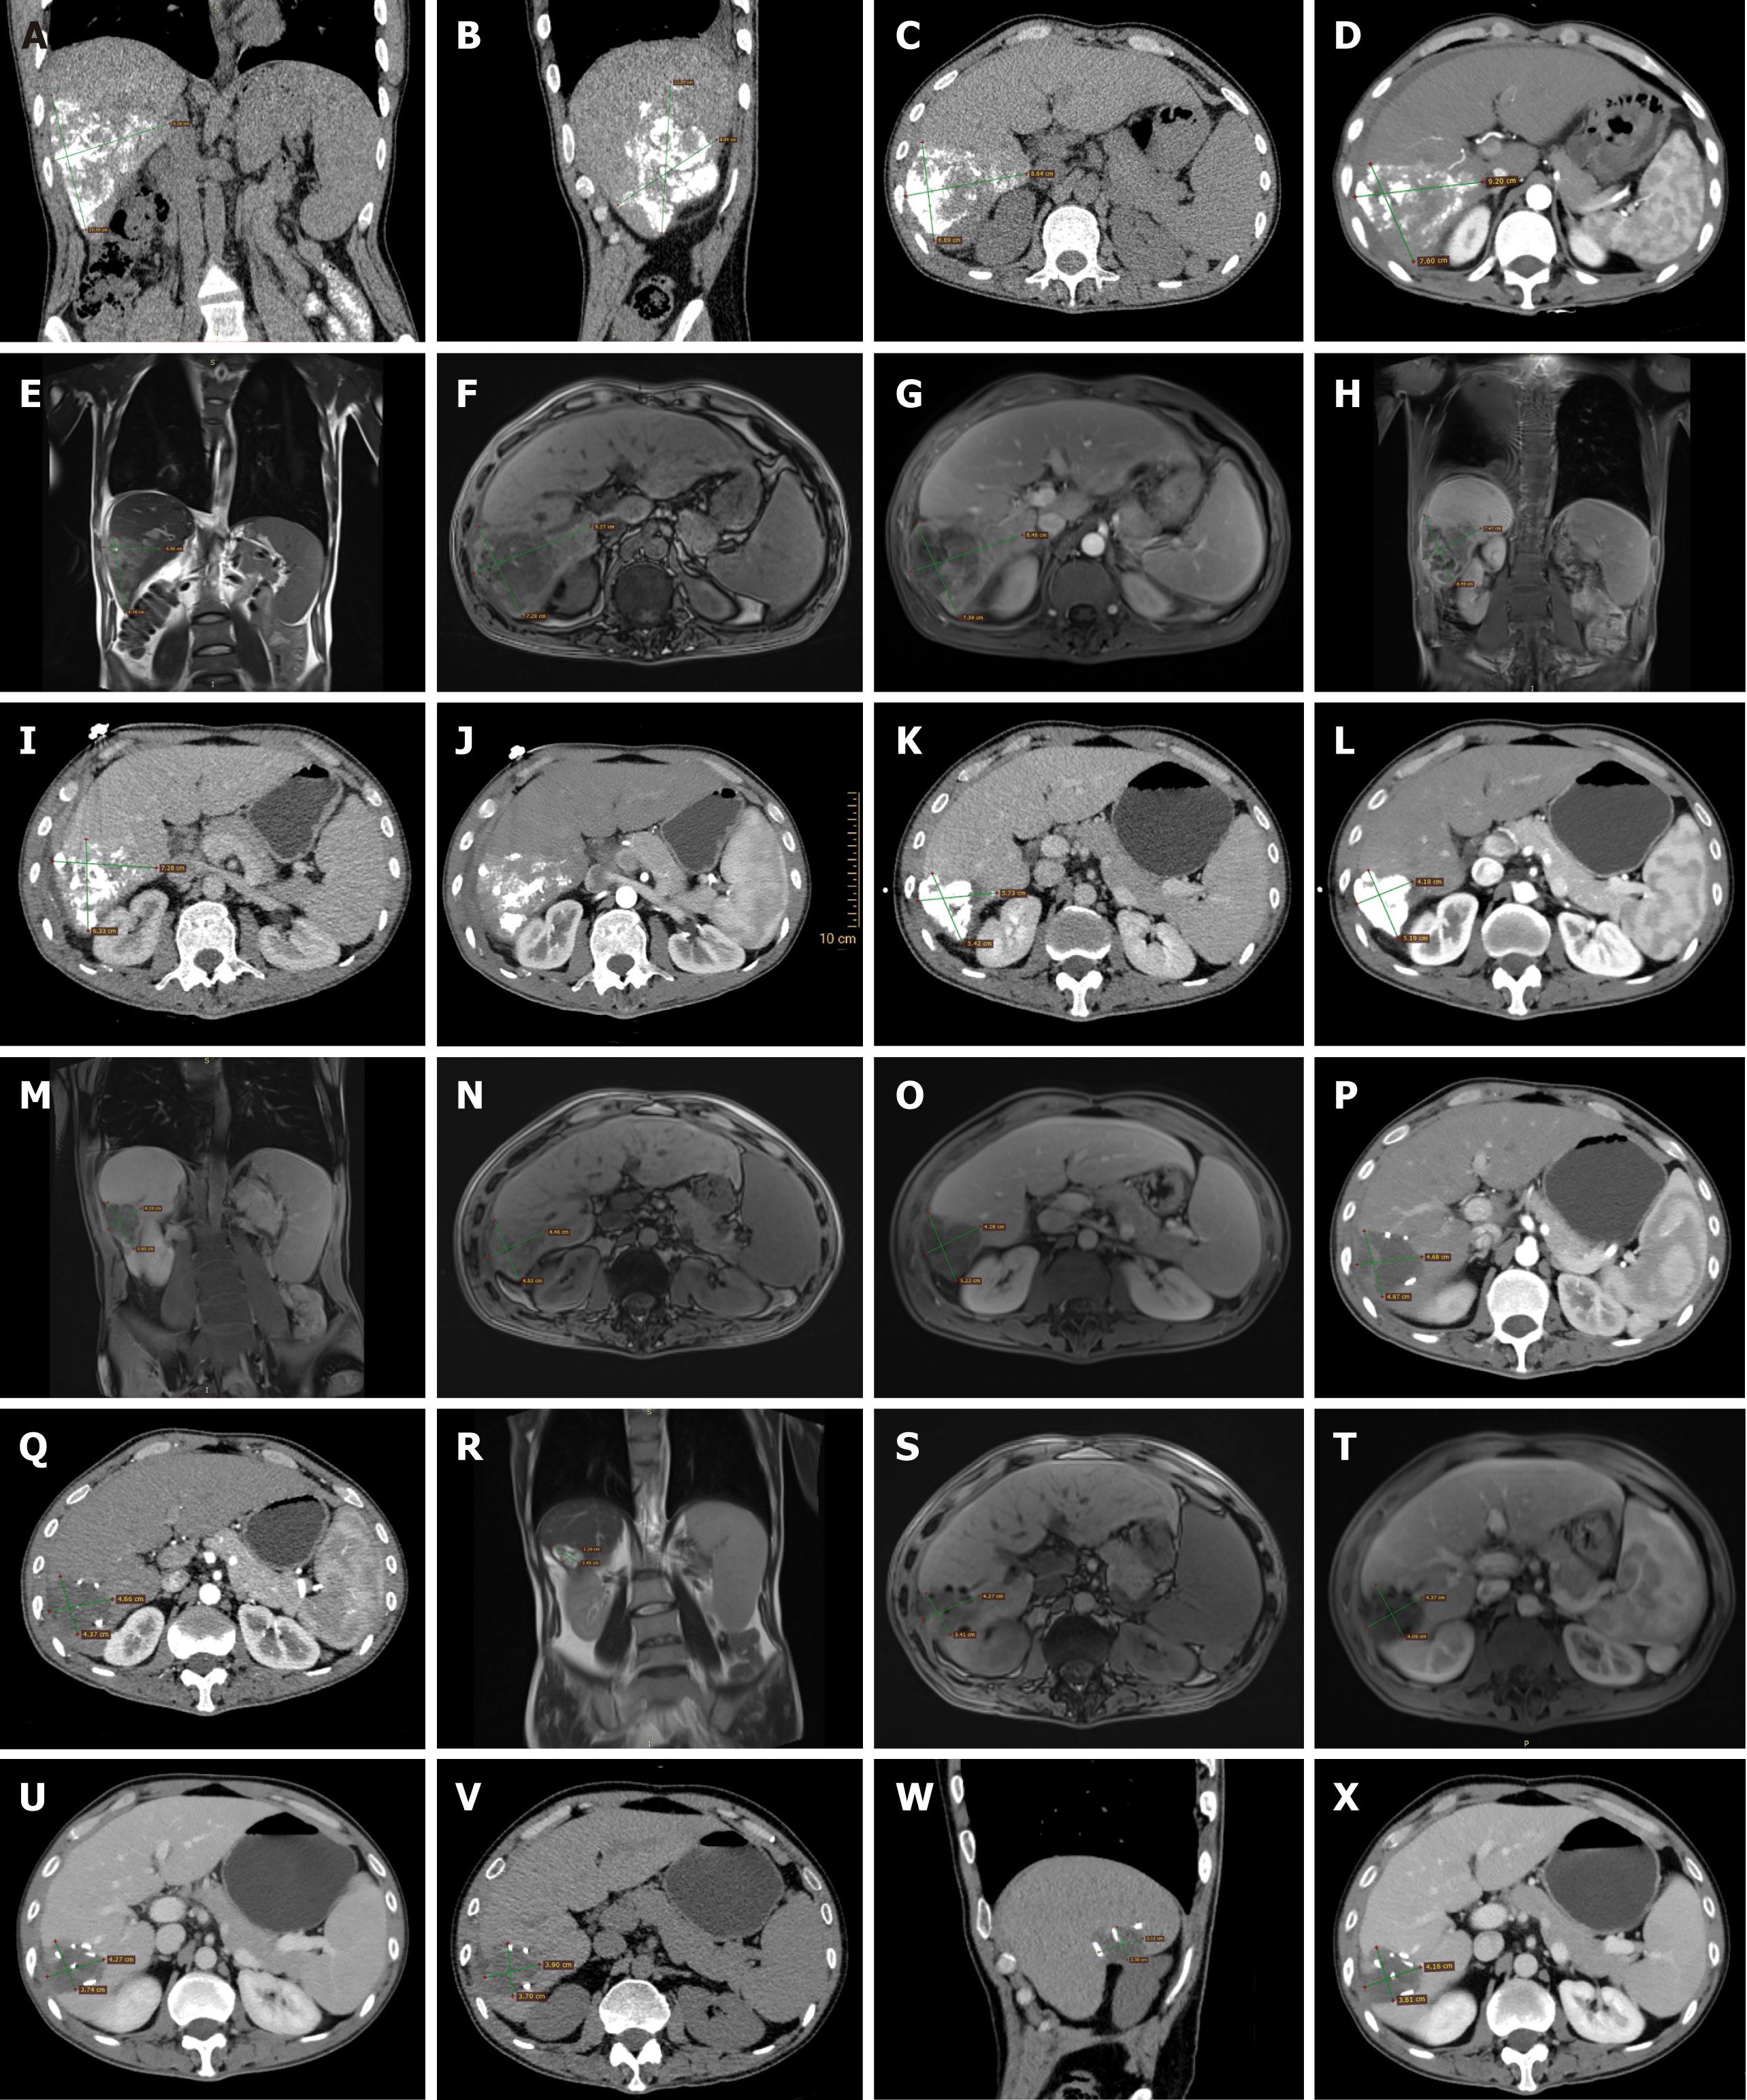
Figure 1 Images of patients after treatment.
A-H: One month postintervention, abdominal computed tomography (CT) and magnetic resonance imaging (MRI) results showed that the liver tumor was located in segments S6-S7 (10.49 cm × 8.64 cm × 6.89 cm), with associated bleeding; I and J: Two months postsurgery, an abdominal CT revealed a decrease in the size of the tumor (7.28 cm × 6.33 cm × 4.5 cm); K-O: Three months postsurgery, plain plus contrast-enhanced abdominal CT and MRI scans indicated that the tumor size was 5.22 cm × 4.28 cm × 4.19 cm, and the activity of the tumor cells had essentially disappeared; P: Six months postsurgery, an enhanced abdominal CT indicated the presence of fluid accumulation in the right lobe of the liver in the surgical area (4.87 cm × 4.68 cm); Q: Eight months postsurgery, an enhanced abdominal CT showed a slight reduction in the size of the surgical area (4.66 cm × 4.37 cm); R-T: At nine months postsurgery, an abdominal MRI plain scan plus contrast enhancement indicated further reduction of the lesion and decreased subcapsular fluid accumulation (4.27 cm × 3.41 cm × 3.45 cm); U: Eleven months postsurgery, an enhanced abdominal CT showed no change in the lesion compared to the previous scan (4.27 cm × 3.74 cm); V-X: Fifteen months postsurgery, an abdominal plain plus contrast-enhanced CT scan indicated no change in the lesion compared to the previous scan (4.16 cm × 3.81 cm × 3.11 cm).
- Citation: Kou XS, Li FF, Meng Y, Zhao JM, Liu SF, Zhang L. Multidisciplinary comprehensive treatment of massive hepatocellular carcinoma with hemorrhage: A case report and review of literature. World J Gastrointest Oncol 2024; 16(5): 2225-2232
- URL: https://www.wjgnet.com/1948-5204/full/v16/i5/2225.htm
- DOI: https://dx.doi.org/10.4251/wjgo.v16.i5.2225


