Copyright
©The Author(s) 2024.
World J Gastrointest Oncol. May 15, 2024; 16(5): 2018-2037
Published online May 15, 2024. doi: 10.4251/wjgo.v16.i5.2018
Published online May 15, 2024. doi: 10.4251/wjgo.v16.i5.2018
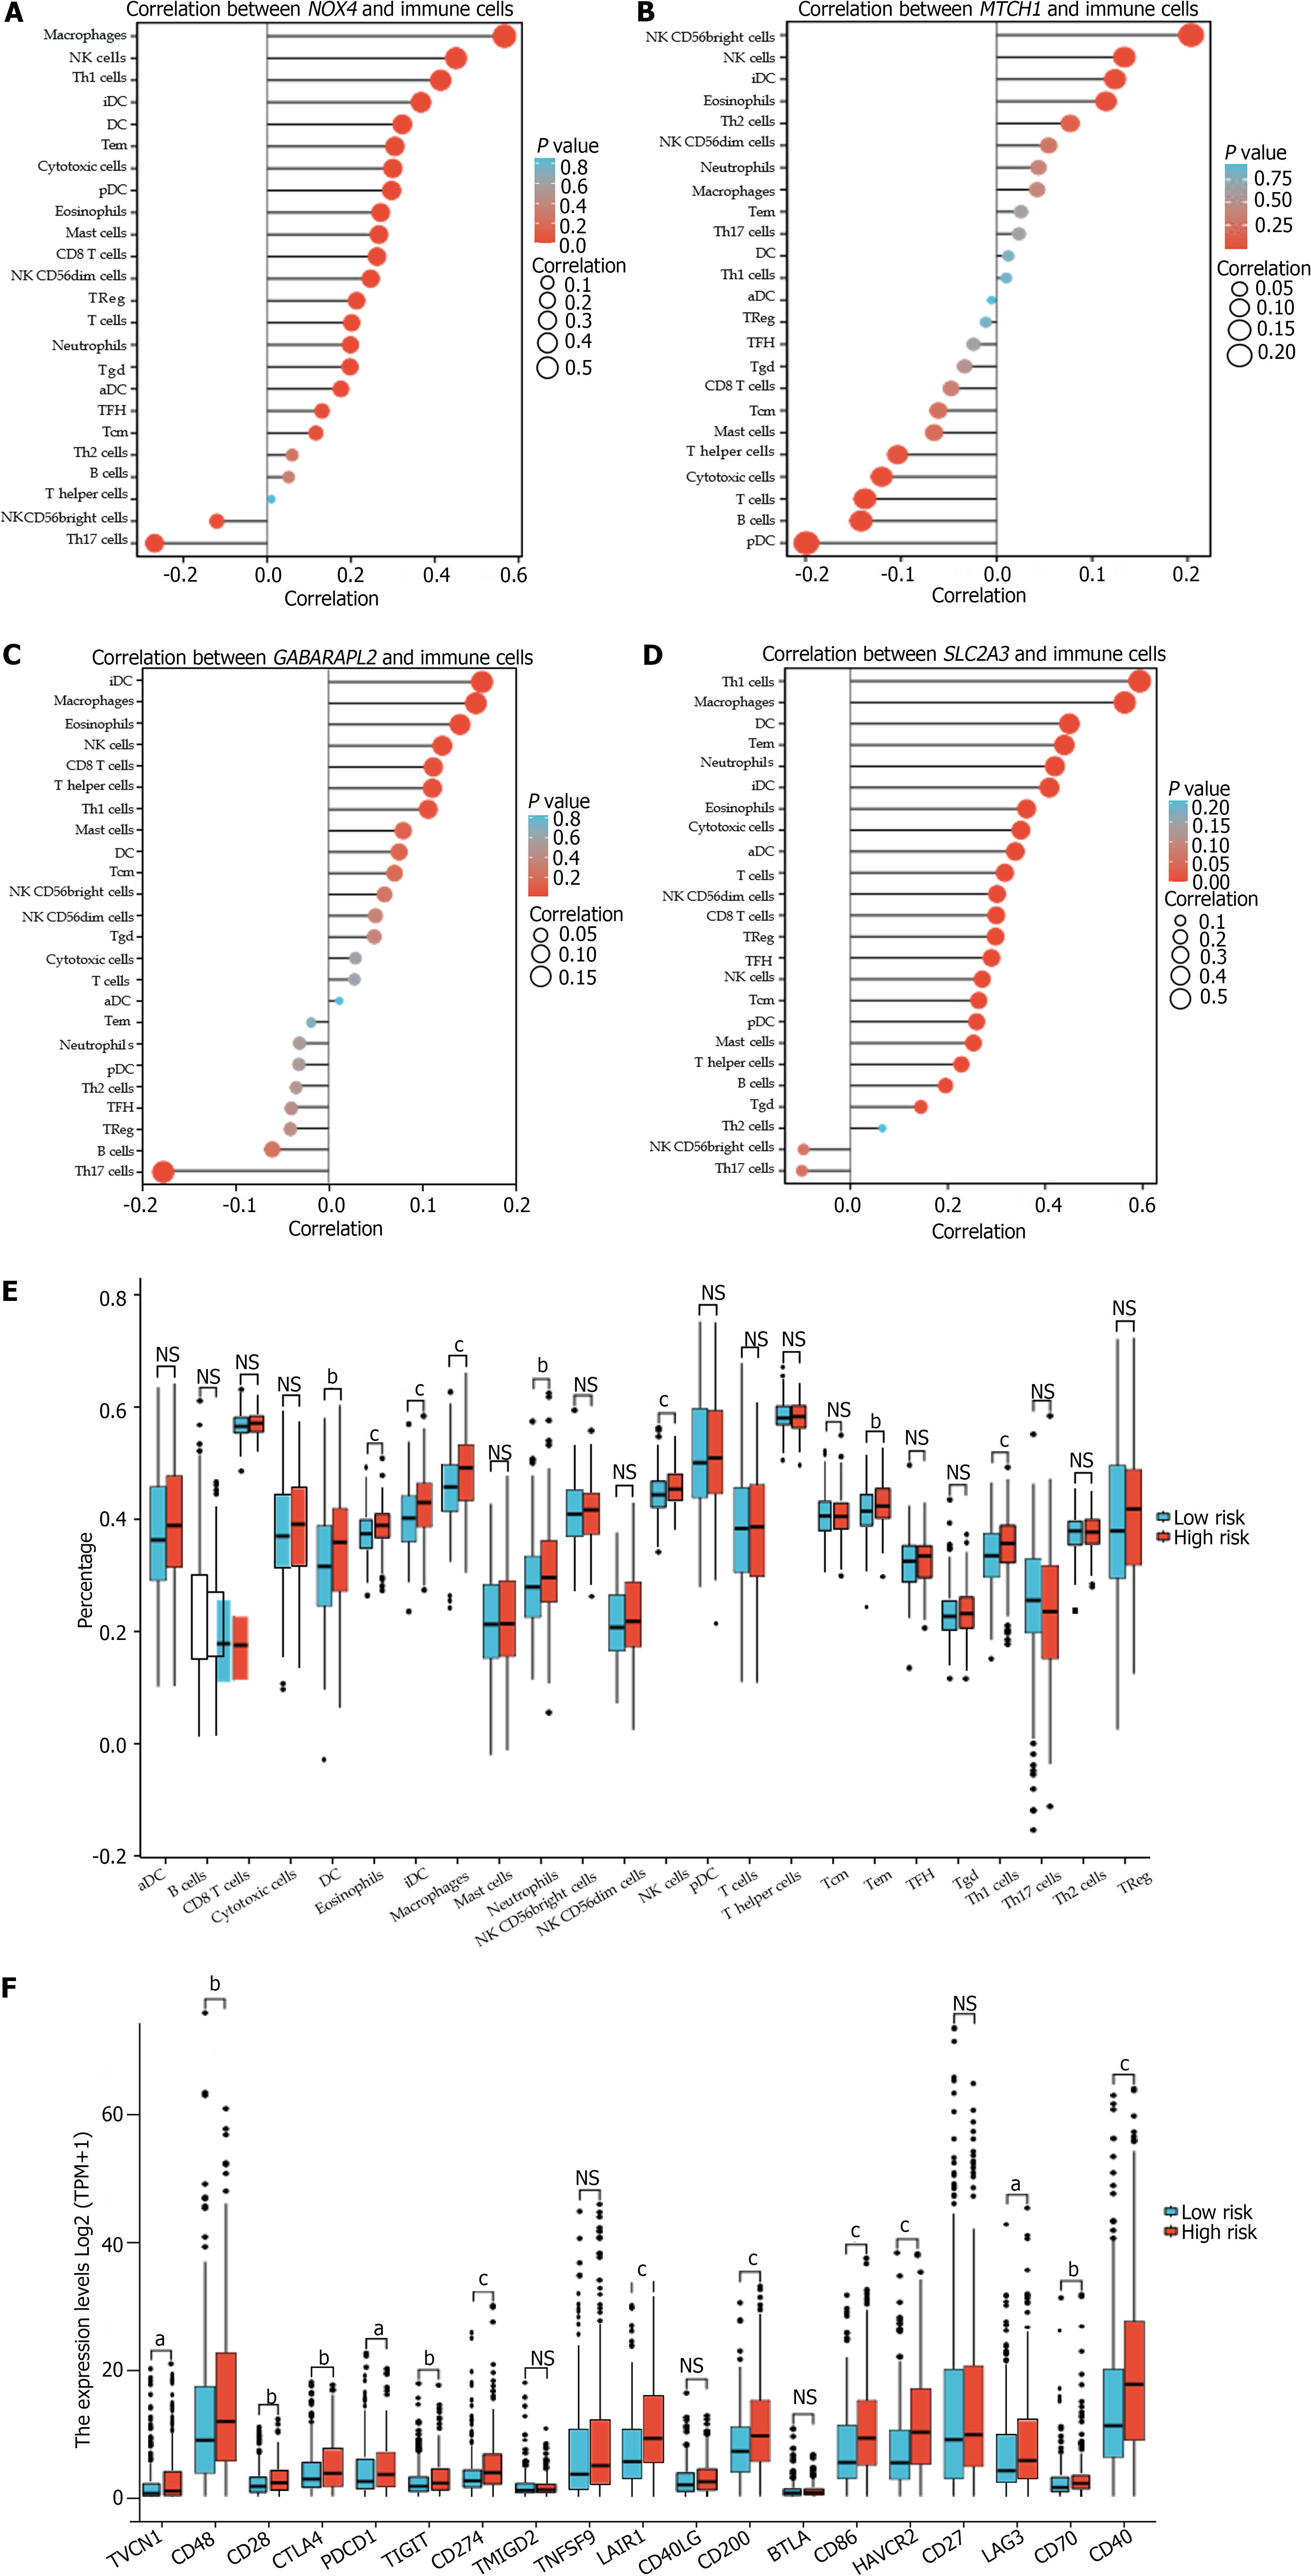
Figure 6 Correlation of hub genes with immune infiltration and immunotherapy.
A: Correlation between NOX4 and immune cells; B: Correlation between MTCH1 and immune cells; C: Correlation between GABARAPL2 and immune cells; D: Correlation between SLC2A3 and immune cells; E: Differences in the ratios of immune cells between the high- and low-risk groups in the cancer genome atlas of stomach adenocarcinoma (TCGA-STAD) cohort; F: Different expression levels of immune checkpoint proteins between the high- and low-risk groups in the TCGA-STAD cohort. aP < 0.05, bP < 0.01, cP < 0.001. NK cell: Natural killer cell; Th1: Type 1 T helper; Th2: Type 2 T helper; iDC: Interdigitating dendritic cells; pDC: Pre-dendritic cells; aDC: Activated dendritic cells; TFH: T-follicular helper; VTCN1: T-cell activation inhibitor-1; PDCD1: Programed cell death 1; TIGIT: T cell immunoreceptor with Ig and ITIM domains; TMIGD2: Transmembrane and immunoglobulin (Ig) domain containing 2; TNFSF9: Tumor necrosis factor superfamily member 9; LAIR1: Leukocyte-associated immunoglobulin-like receptor 1; BTLA: B- and T-lymphocyte attenuator; HAVCR2: Hepatitis A virus cellular receptor; 2LAG3: Lymphocyte activating gene 3.
- Citation: Wang L, Gong WH. Predictive model using four ferroptosis-related genes accurately predicts gastric cancer prognosis. World J Gastrointest Oncol 2024; 16(5): 2018-2037
- URL: https://www.wjgnet.com/1948-5204/full/v16/i5/2018.htm
- DOI: https://dx.doi.org/10.4251/wjgo.v16.i5.2018


