Copyright
©The Author(s) 2024.
World J Gastrointest Oncol. May 15, 2024; 16(5): 2018-2037
Published online May 15, 2024. doi: 10.4251/wjgo.v16.i5.2018
Published online May 15, 2024. doi: 10.4251/wjgo.v16.i5.2018
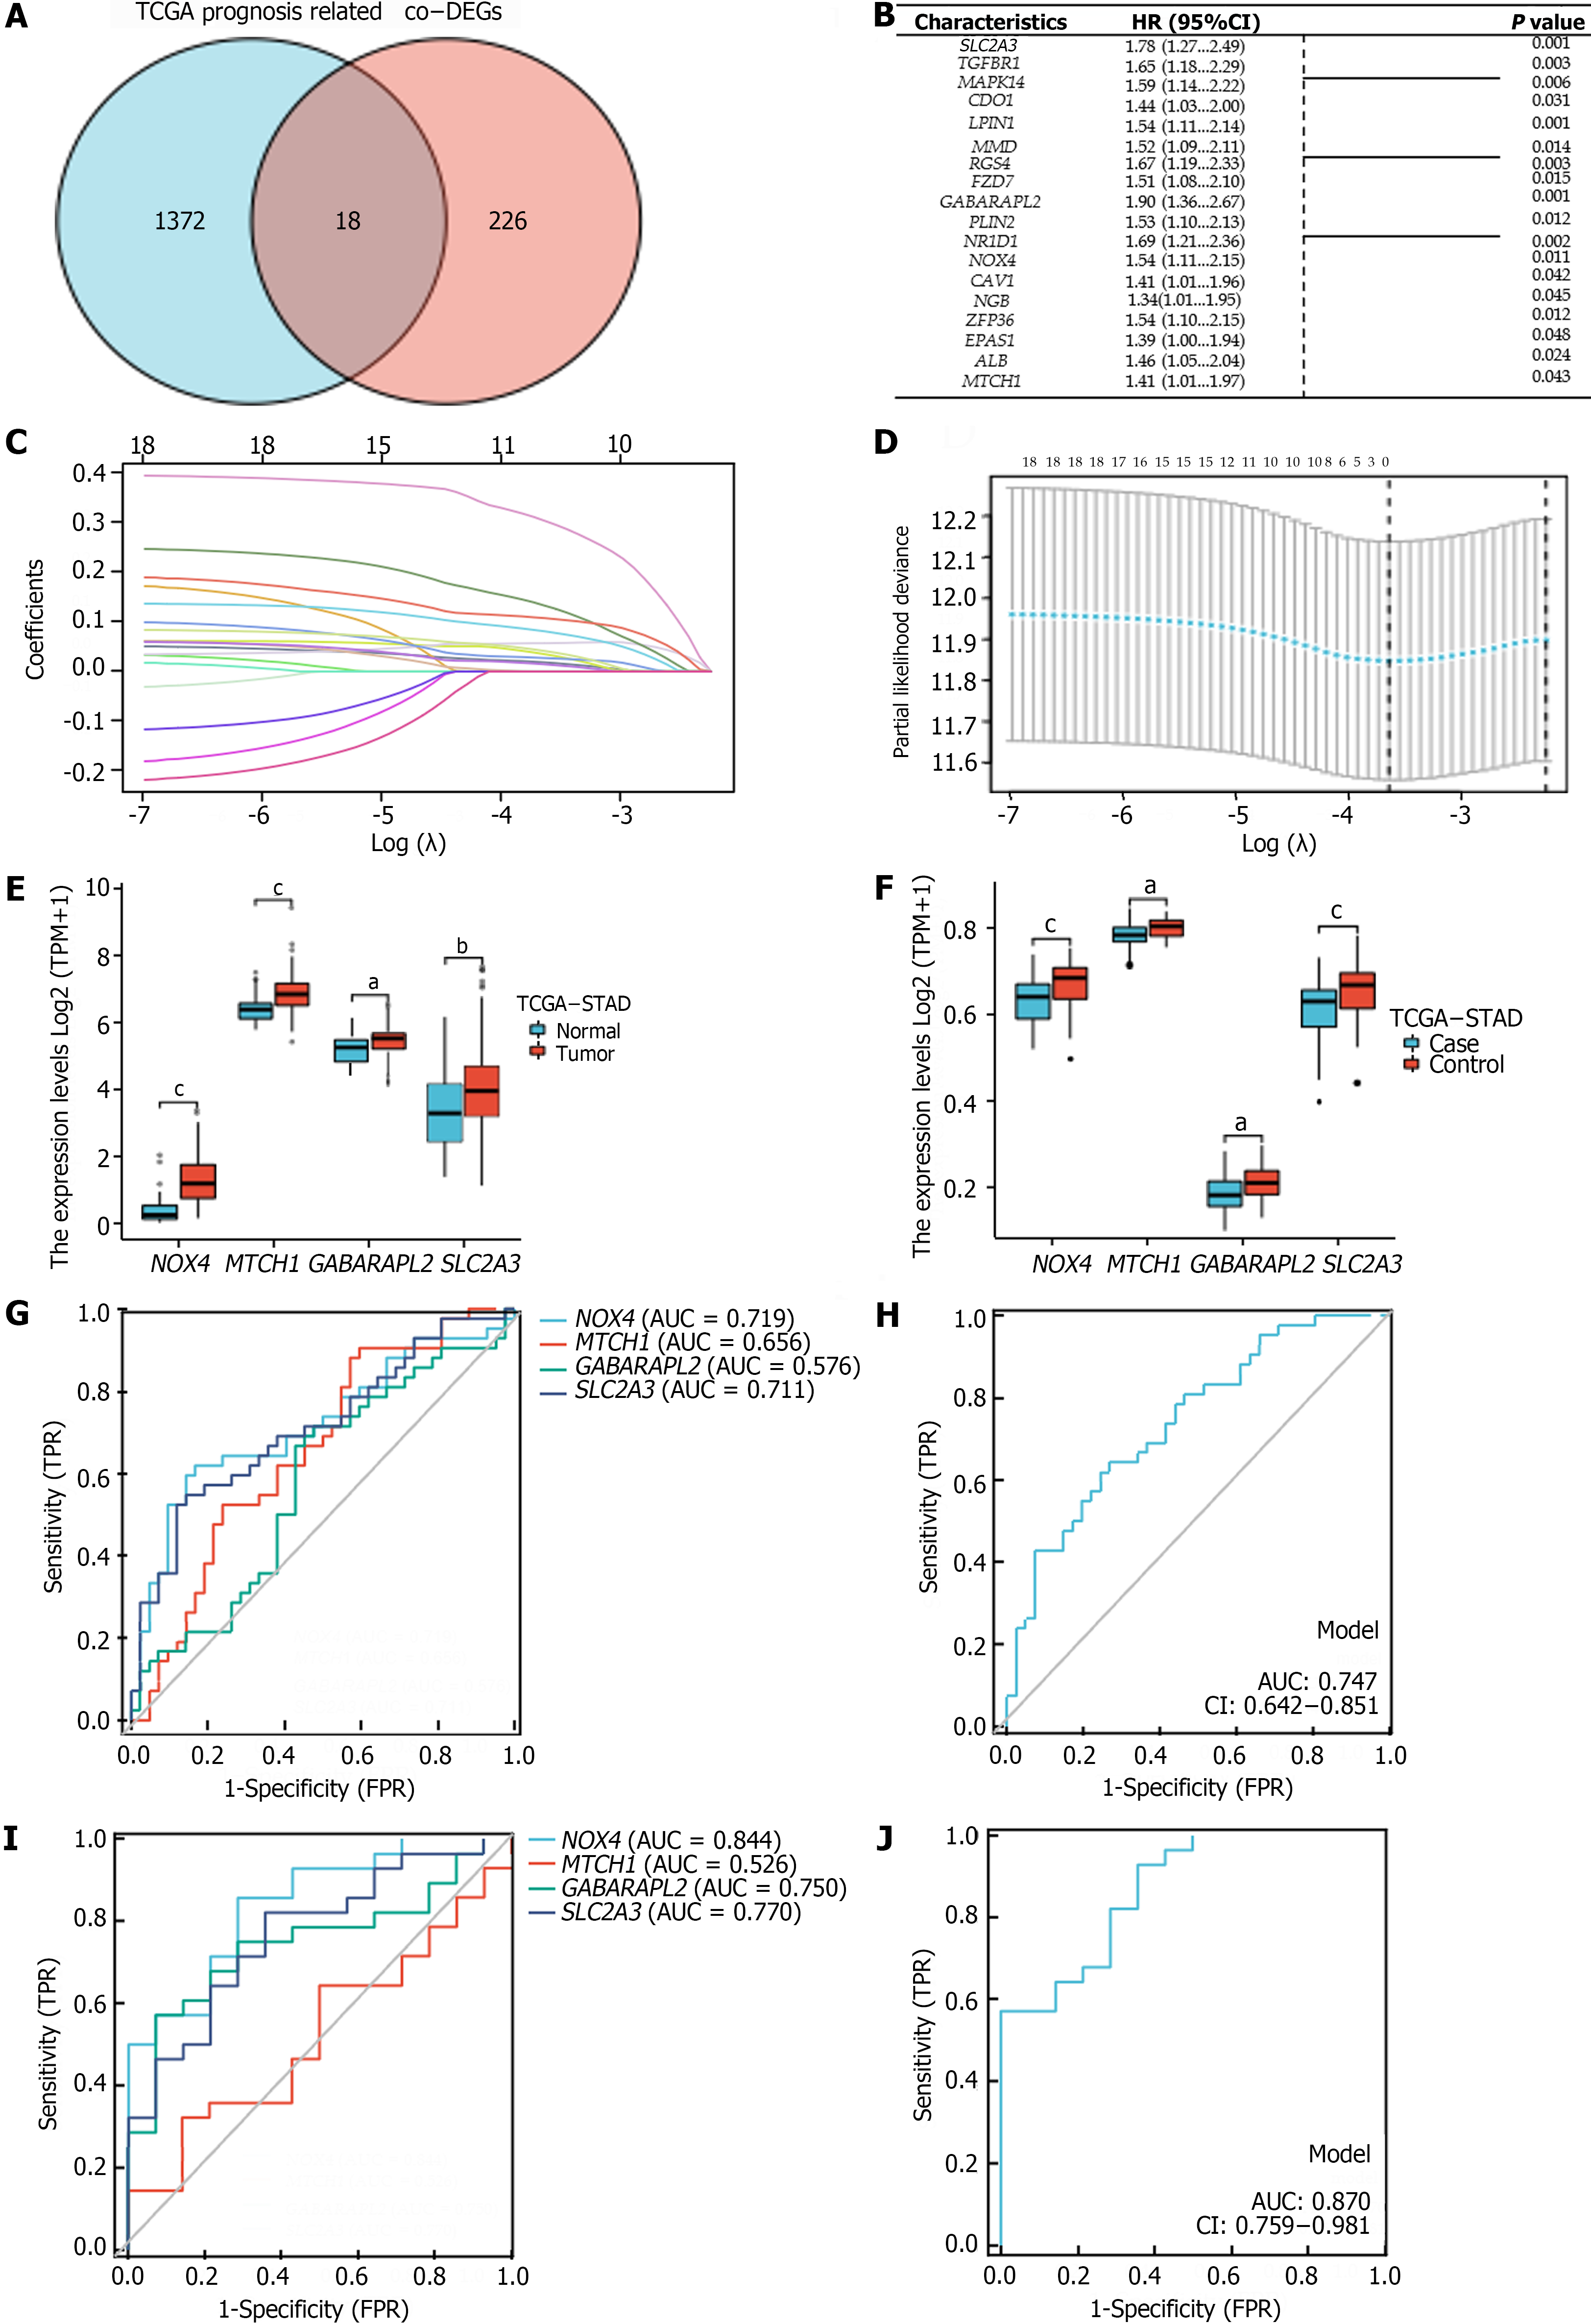
Figure 3 Construction of the ferroptosis-related genes prognostic index and its value in predicting gastric cancer.
A: Overlap of differentially expressed genes and prognostic genes; B: Forest plot showing the multivariate Cox model results for the Co-regulated differentially expressed genes; C and D: LASSO analysis of related genes; E: Expression of hub genes in gastric cancer (GC) and normal tissues (The Cancer Genome Atlas); F: Expression of hub genes in GC and normal tissues (GSE99553); G: Receiver operating characteristic curves (ROC) of hub genes for predicting GC (GSE99553); H: H: ROC curves of hub genes combined detection for predicting GC (GSE99553); I: ROC curve of hub genes for predicting H. pylori infection-related GC (GSE99553); J: ROC curve of hub genes combined detection for predicting H. pylori infection-related GC (GSE99553). aP < 0.05, bP < 0.01, cP < 0.001. TCGA-STAD: The cancer genome atlas of stomach adenocarcinoma; AUC: Areas under the curve; FPR: False positive rate; HR: Hazard ratio; TPR: True positive rate.
- Citation: Wang L, Gong WH. Predictive model using four ferroptosis-related genes accurately predicts gastric cancer prognosis. World J Gastrointest Oncol 2024; 16(5): 2018-2037
- URL: https://www.wjgnet.com/1948-5204/full/v16/i5/2018.htm
- DOI: https://dx.doi.org/10.4251/wjgo.v16.i5.2018


