Copyright
©The Author(s) 2024.
World J Gastrointest Oncol. May 15, 2024; 16(5): 1965-1994
Published online May 15, 2024. doi: 10.4251/wjgo.v16.i5.1965
Published online May 15, 2024. doi: 10.4251/wjgo.v16.i5.1965
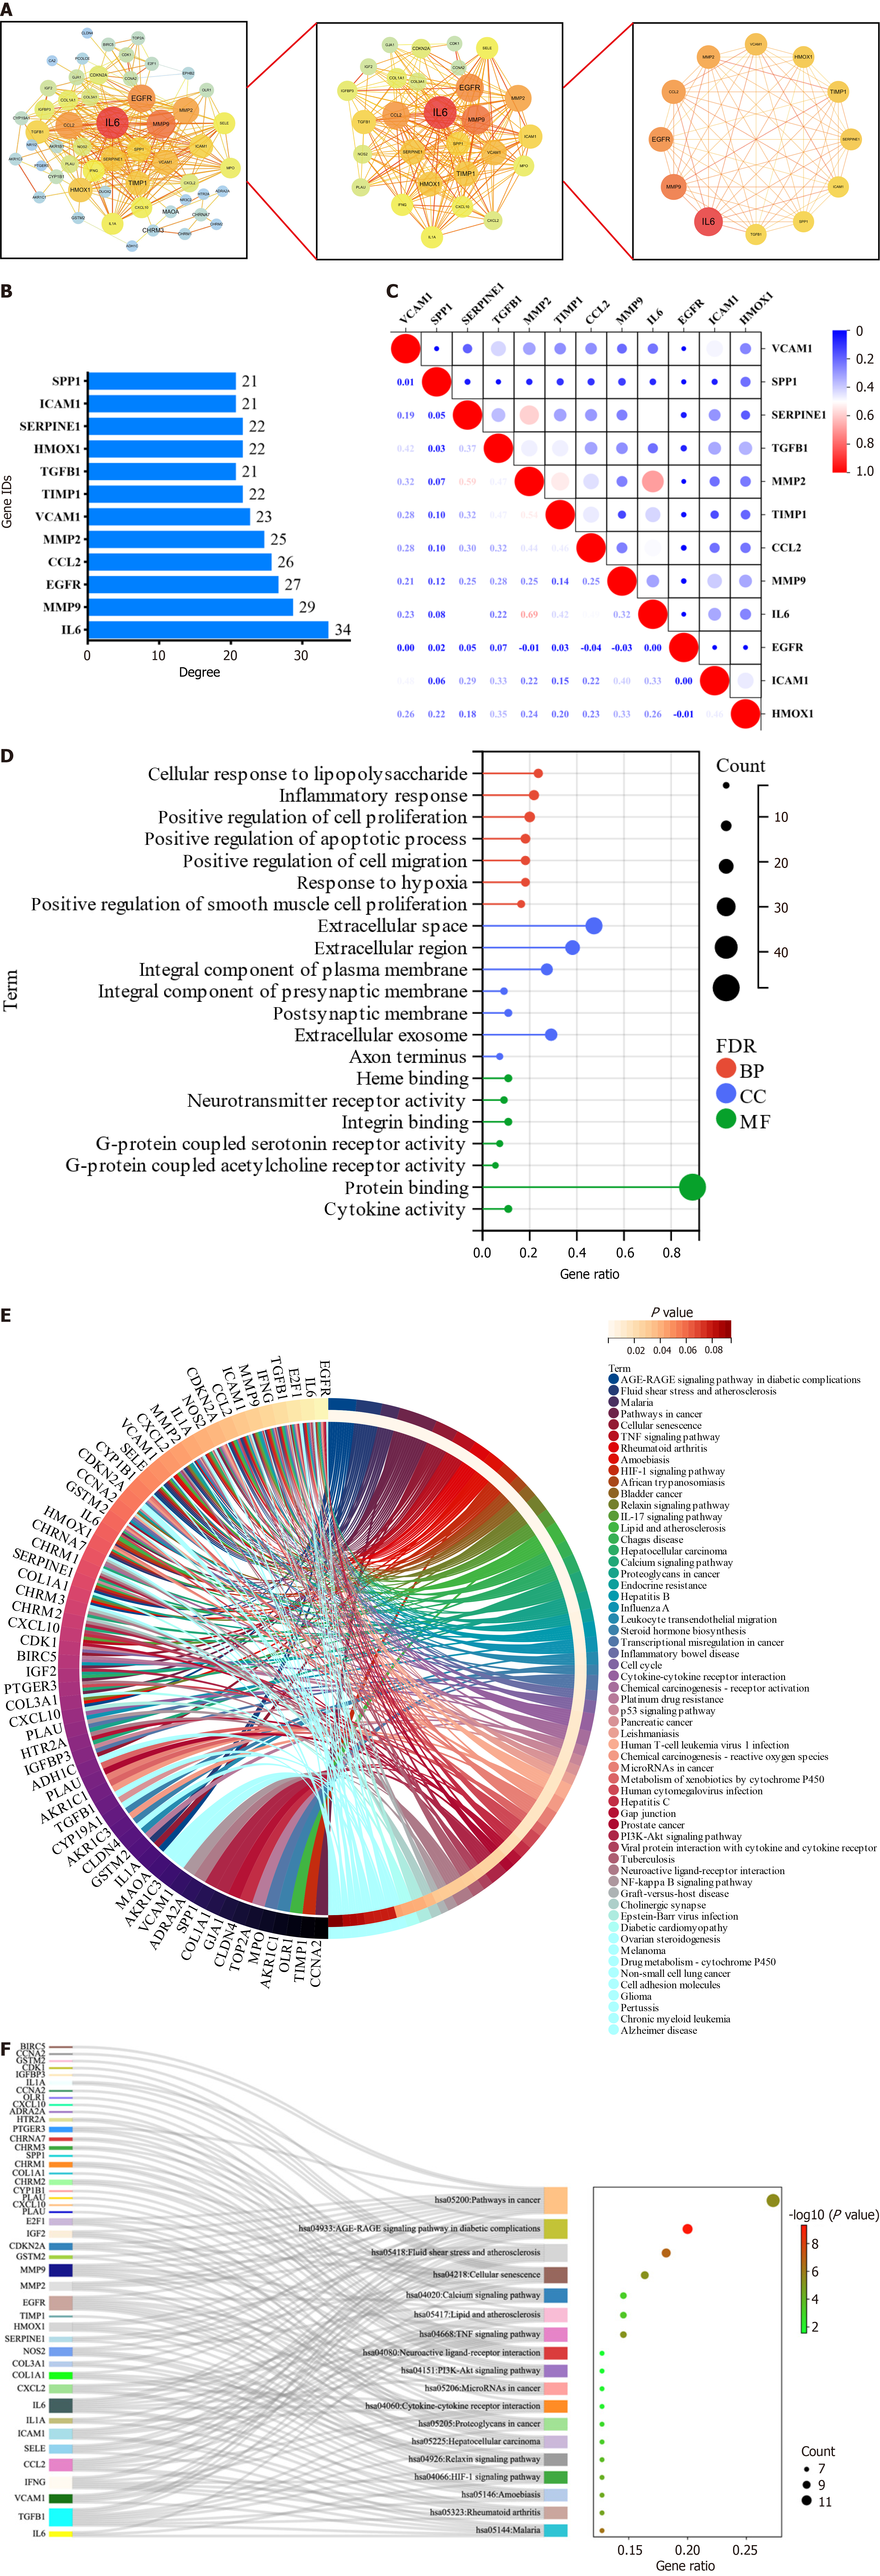
Figure 3 Screening and enrichment analysis of core targets.
A: Screening process of protein-protein interaction network; B: Degree value of core targets; C: Correlation heatmap of the core targets; D: Gene ontology plot of intersecting targets; E: Kyoto Encyclopedia of Genes (KEGG) And Genomes diagram of intersecting targets; F: Ranking of the front KEGG Sankey diagram. BP: Biological process; CC: Cellular localization; MF: Molecular function.
- Citation: Lu DD, Yuan L, Wang ZZ, Zhao JJ, Du YH, Ning N, Chen GQ, Huang SC, Yang Y, Zhang Z, Nan Y. To explore the mechanism of Yigong San anti-gastric cancer and immune regulation. World J Gastrointest Oncol 2024; 16(5): 1965-1994
- URL: https://www.wjgnet.com/1948-5204/full/v16/i5/1965.htm
- DOI: https://dx.doi.org/10.4251/wjgo.v16.i5.1965


