Copyright
©The Author(s) 2024.
World J Gastrointest Oncol. May 15, 2024; 16(5): 1965-1994
Published online May 15, 2024. doi: 10.4251/wjgo.v16.i5.1965
Published online May 15, 2024. doi: 10.4251/wjgo.v16.i5.1965
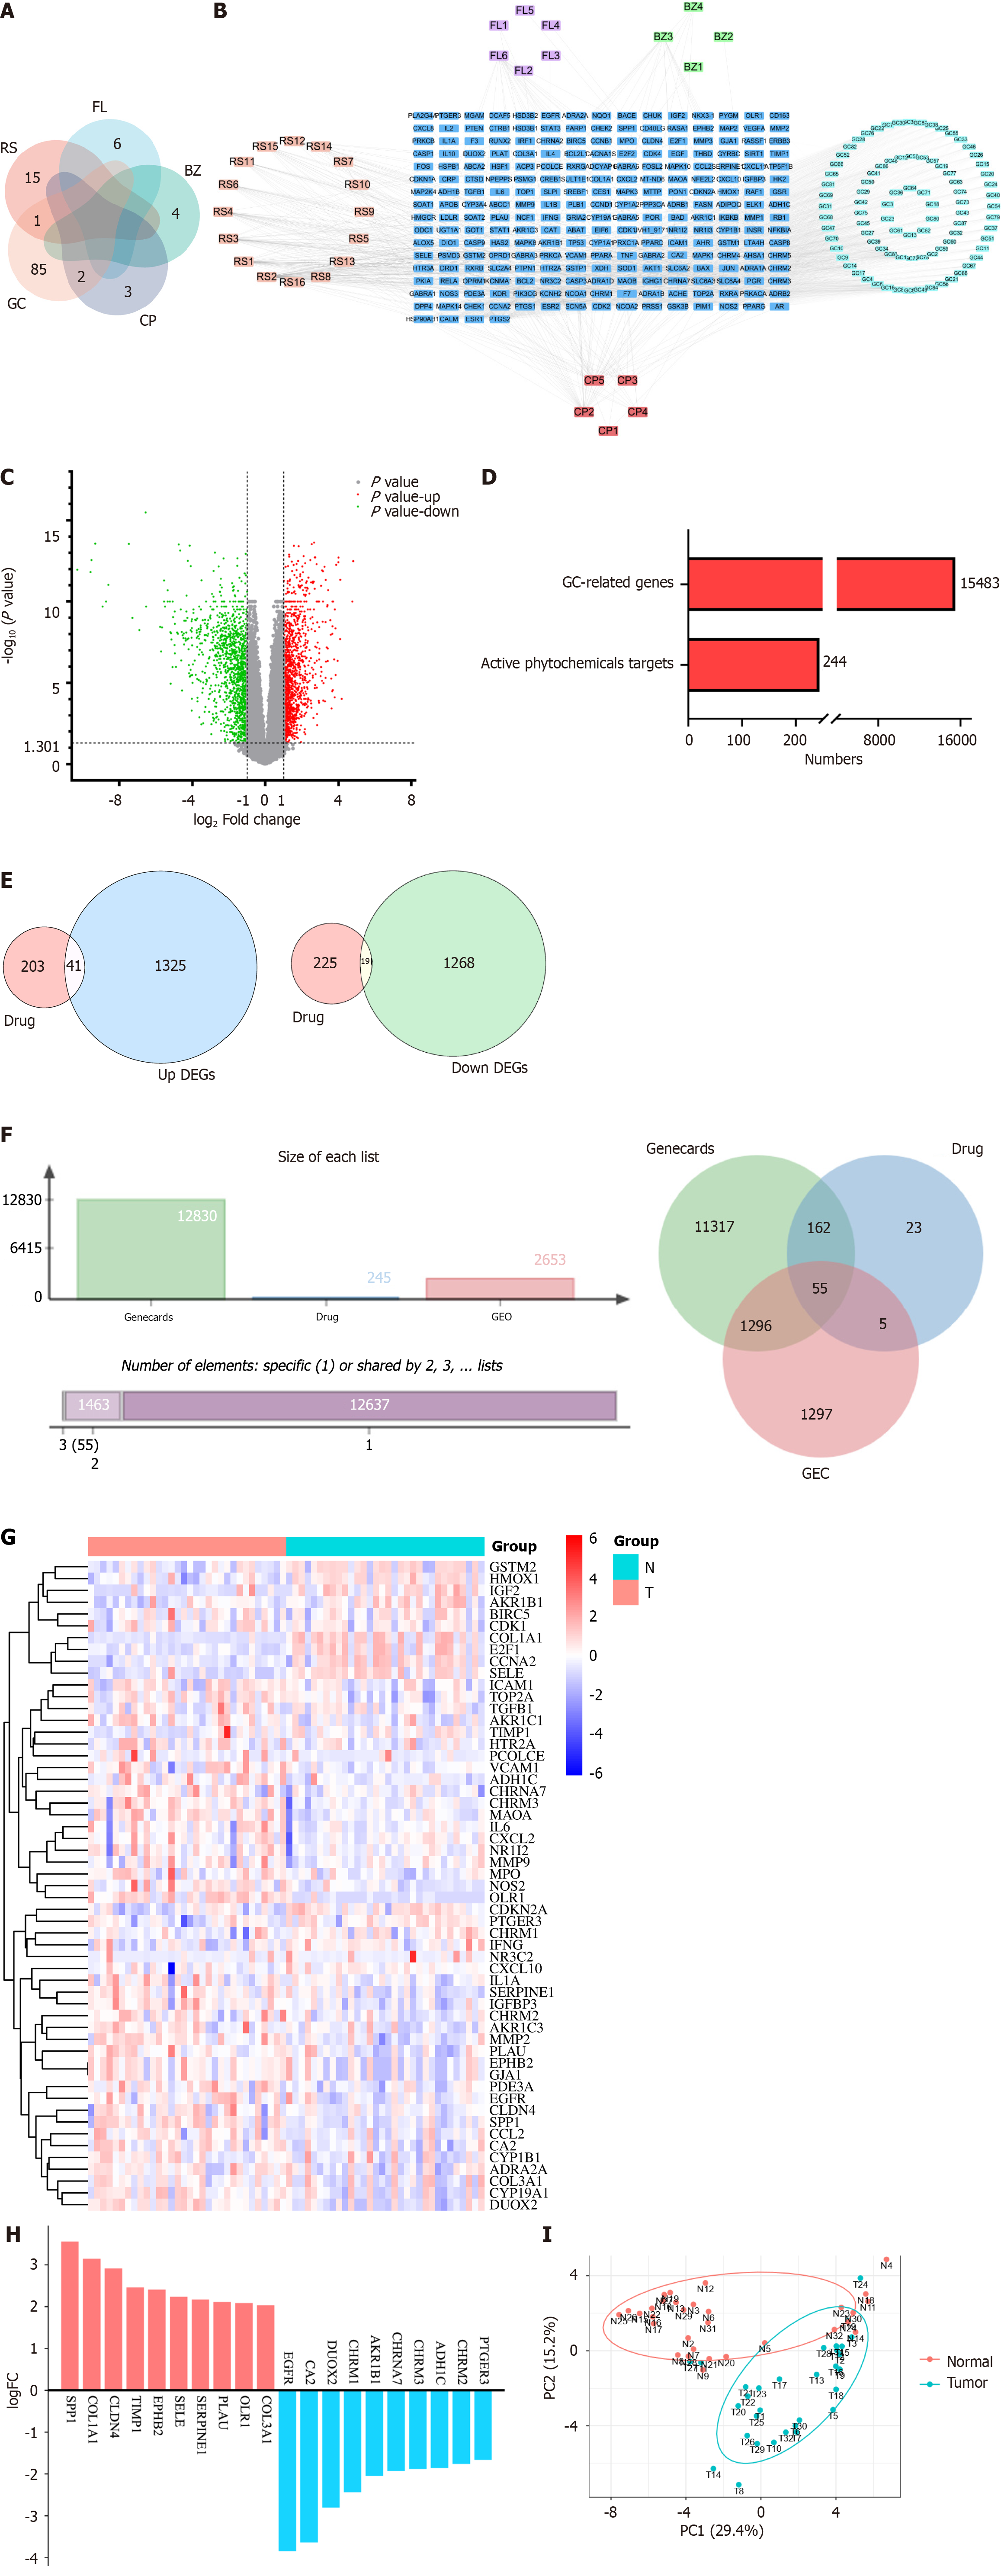
Figure 2 The targets of Yigong San ingredients and differentially expressed genes in gastric cancer.
A: Intersection plot of the number of active ingredients of Yigong San (YGS); B: Network diagram of YGS active ingredient-targets. Pink, purple, green, light green and red colors represent Renshen, Fuling, Baizhu, Gancao and Chenpi, respectively, and blue color represents all the targets of active ingredients; C: Volcano plot of differentially expressed genes of GSE65801; D: All genes of gastric cancer and the number of targets of YGS active ingredients; E: Intersection of up- and down-regulated genes of gastric cancer and targets of YGS; F: Intersection plot of YGS and gastric cancer targets; G: Heatmap of intersecting targets; H: Log-fold change values of the top 10 up- and down-regulated genes in the intersection targets; I: Principal co-ordinates analysis plots of the samples of the intersecting targets. RS: Renshen; FL: Fuling; BZ: Baizhu; GC: Gancao; CP: Chenpi; DEG: Differentially expressed gene; LogFC: Log-fold change; PCoA: Principal co-ordinates analysis.
- Citation: Lu DD, Yuan L, Wang ZZ, Zhao JJ, Du YH, Ning N, Chen GQ, Huang SC, Yang Y, Zhang Z, Nan Y. To explore the mechanism of Yigong San anti-gastric cancer and immune regulation. World J Gastrointest Oncol 2024; 16(5): 1965-1994
- URL: https://www.wjgnet.com/1948-5204/full/v16/i5/1965.htm
- DOI: https://dx.doi.org/10.4251/wjgo.v16.i5.1965


