Copyright
©The Author(s) 2024.
World J Gastrointest Oncol. May 15, 2024; 16(5): 1908-1924
Published online May 15, 2024. doi: 10.4251/wjgo.v16.i5.1908
Published online May 15, 2024. doi: 10.4251/wjgo.v16.i5.1908
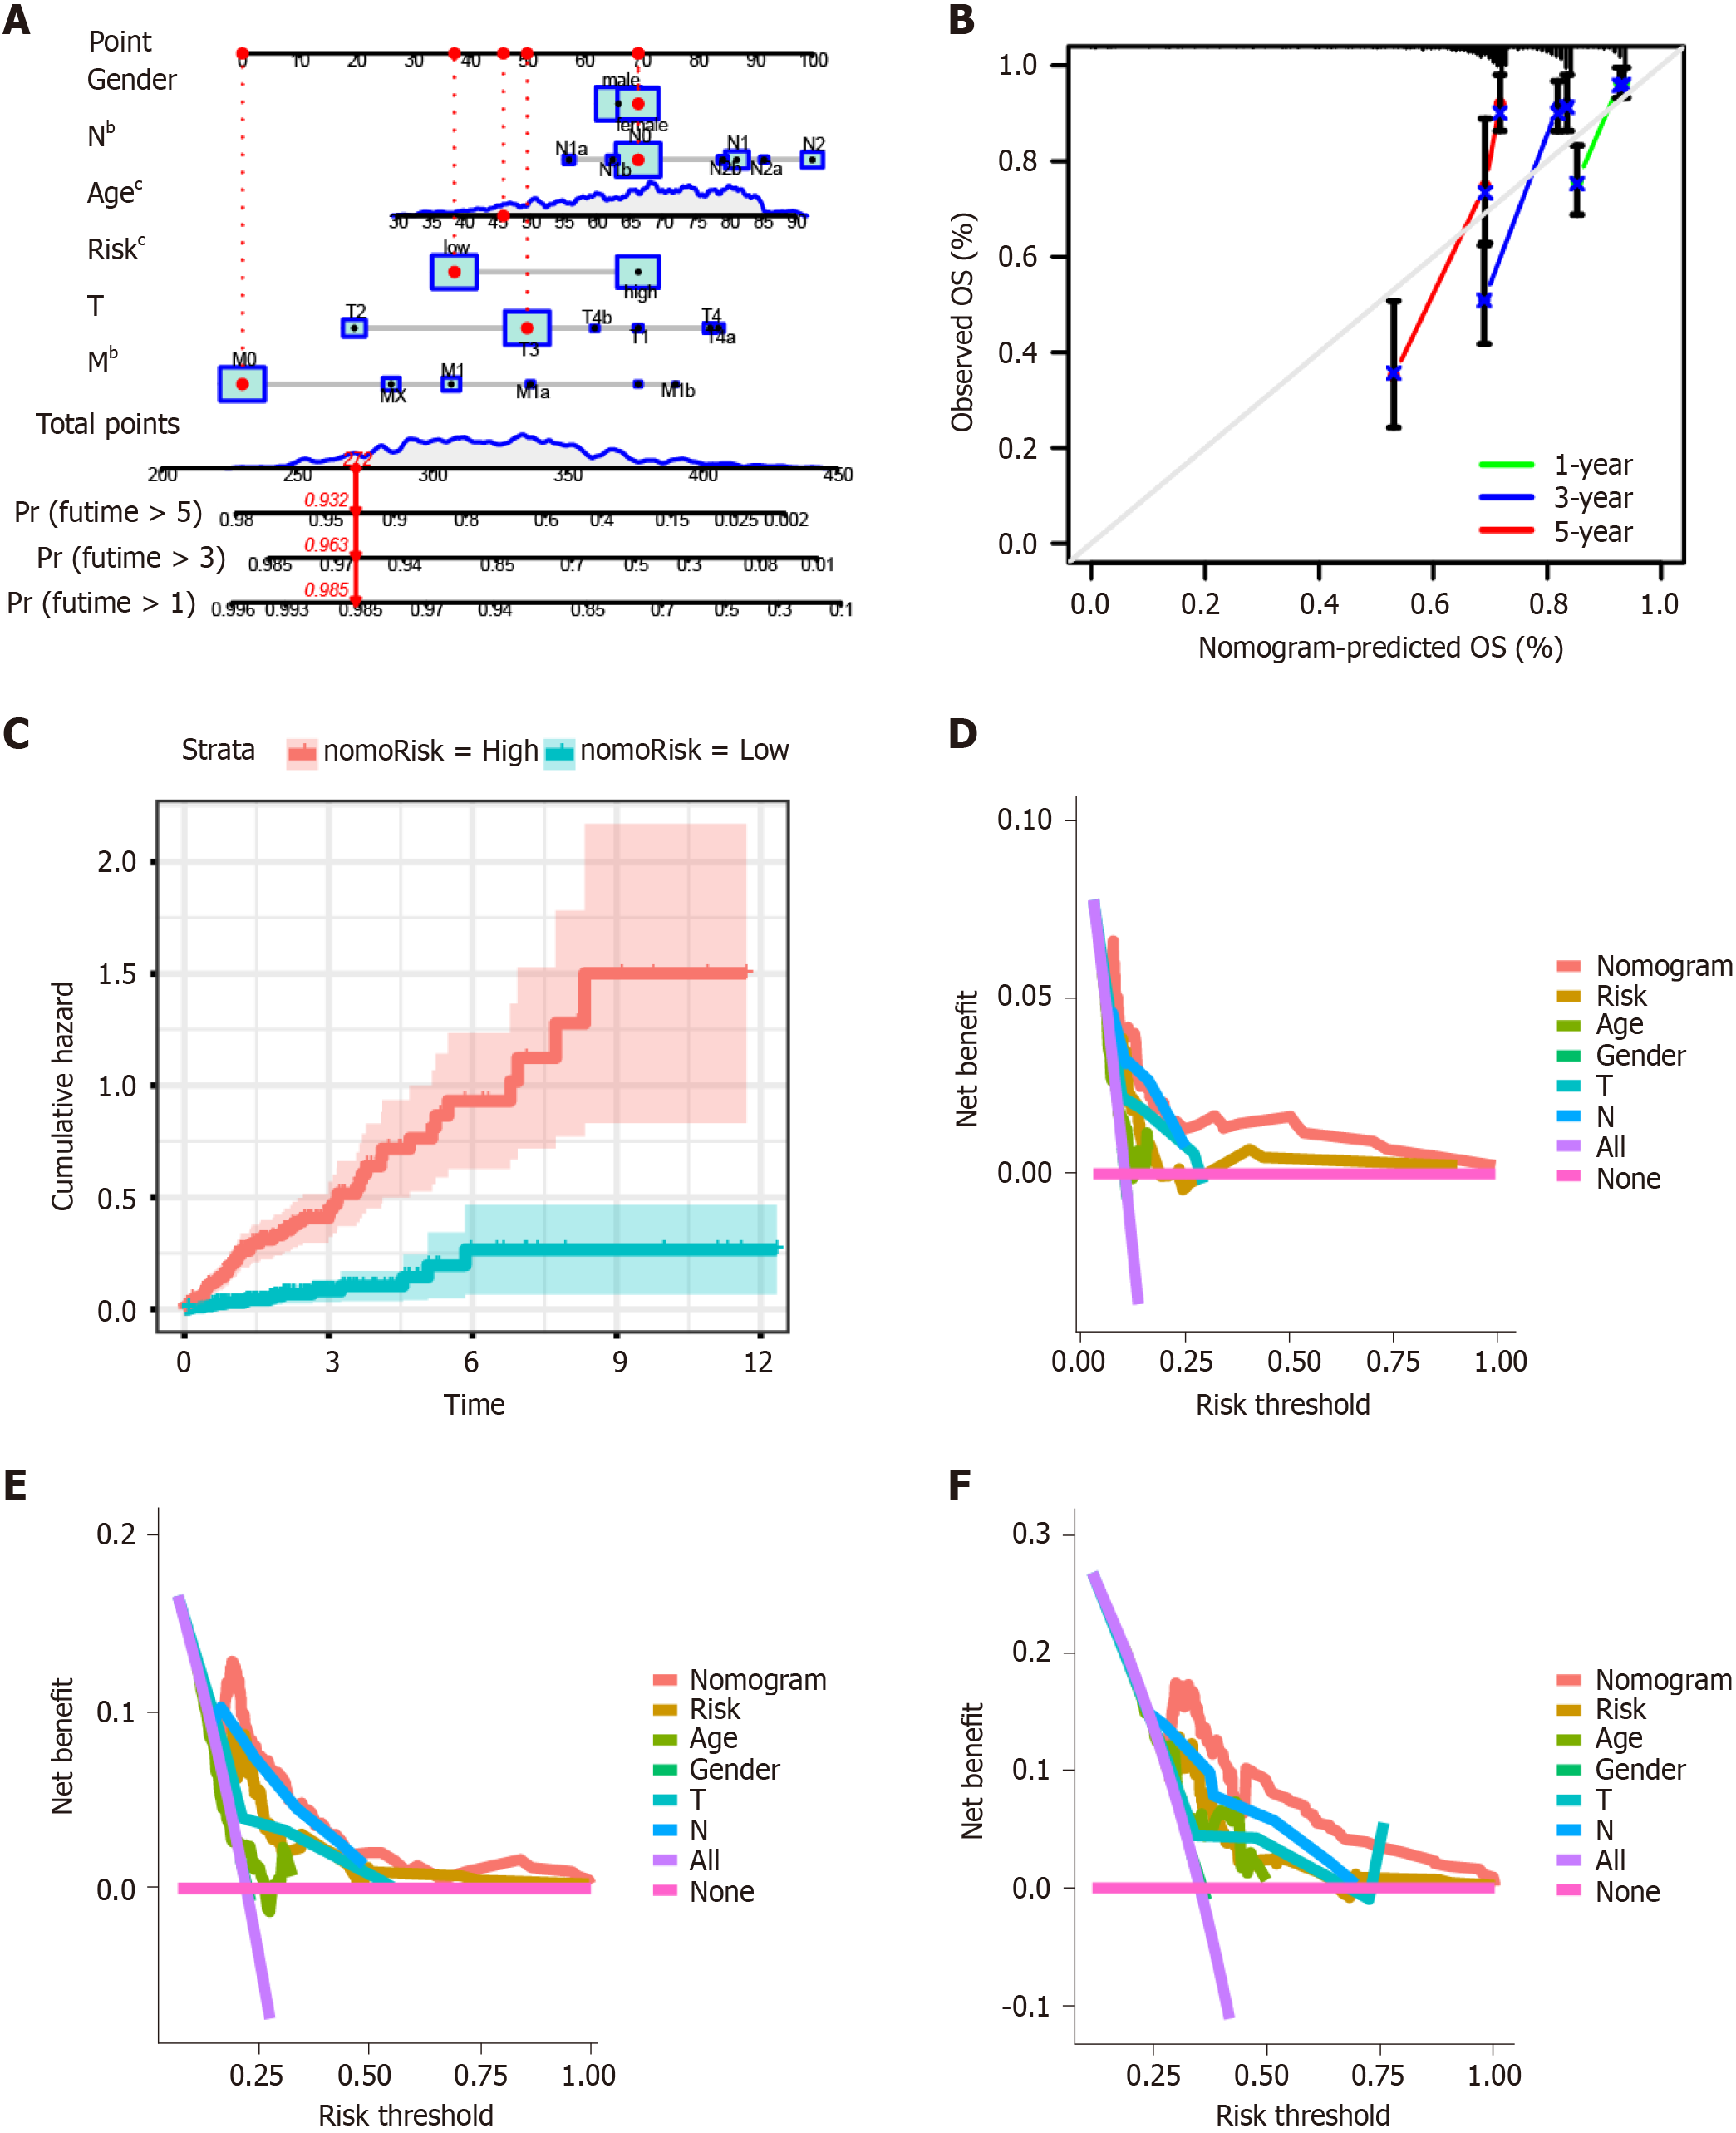
Figure 4 Construction of the prognostic nomogram.
A: A nomogram model was established to predict the prognostic of patients with colon cancer; B: Calibration curve showing the probability of 1-, 3-, and 5-year overall survival (OS) of patients with colon cancer; C: The cumulative hazard index of the model; D-F: Decision curve analysis showed the accuracy of the nomogram model was the best in predicting 1-, 3-, and 5-year OS among the predictors used in this study. bP < 0.01. cP < 0.001 vs high-risk and low-risk groups. AUC: Area under the curve.
- Citation: Wang HY, Diao Y, Tan PZ, Liang H. Four centrosome-related genes to predict the prognosis and drug sensitivity of patients with colon cancer. World J Gastrointest Oncol 2024; 16(5): 1908-1924
- URL: https://www.wjgnet.com/1948-5204/full/v16/i5/1908.htm
- DOI: https://dx.doi.org/10.4251/wjgo.v16.i5.1908


