Copyright
©The Author(s) 2024.
World J Gastrointest Oncol. May 15, 2024; 16(5): 1908-1924
Published online May 15, 2024. doi: 10.4251/wjgo.v16.i5.1908
Published online May 15, 2024. doi: 10.4251/wjgo.v16.i5.1908
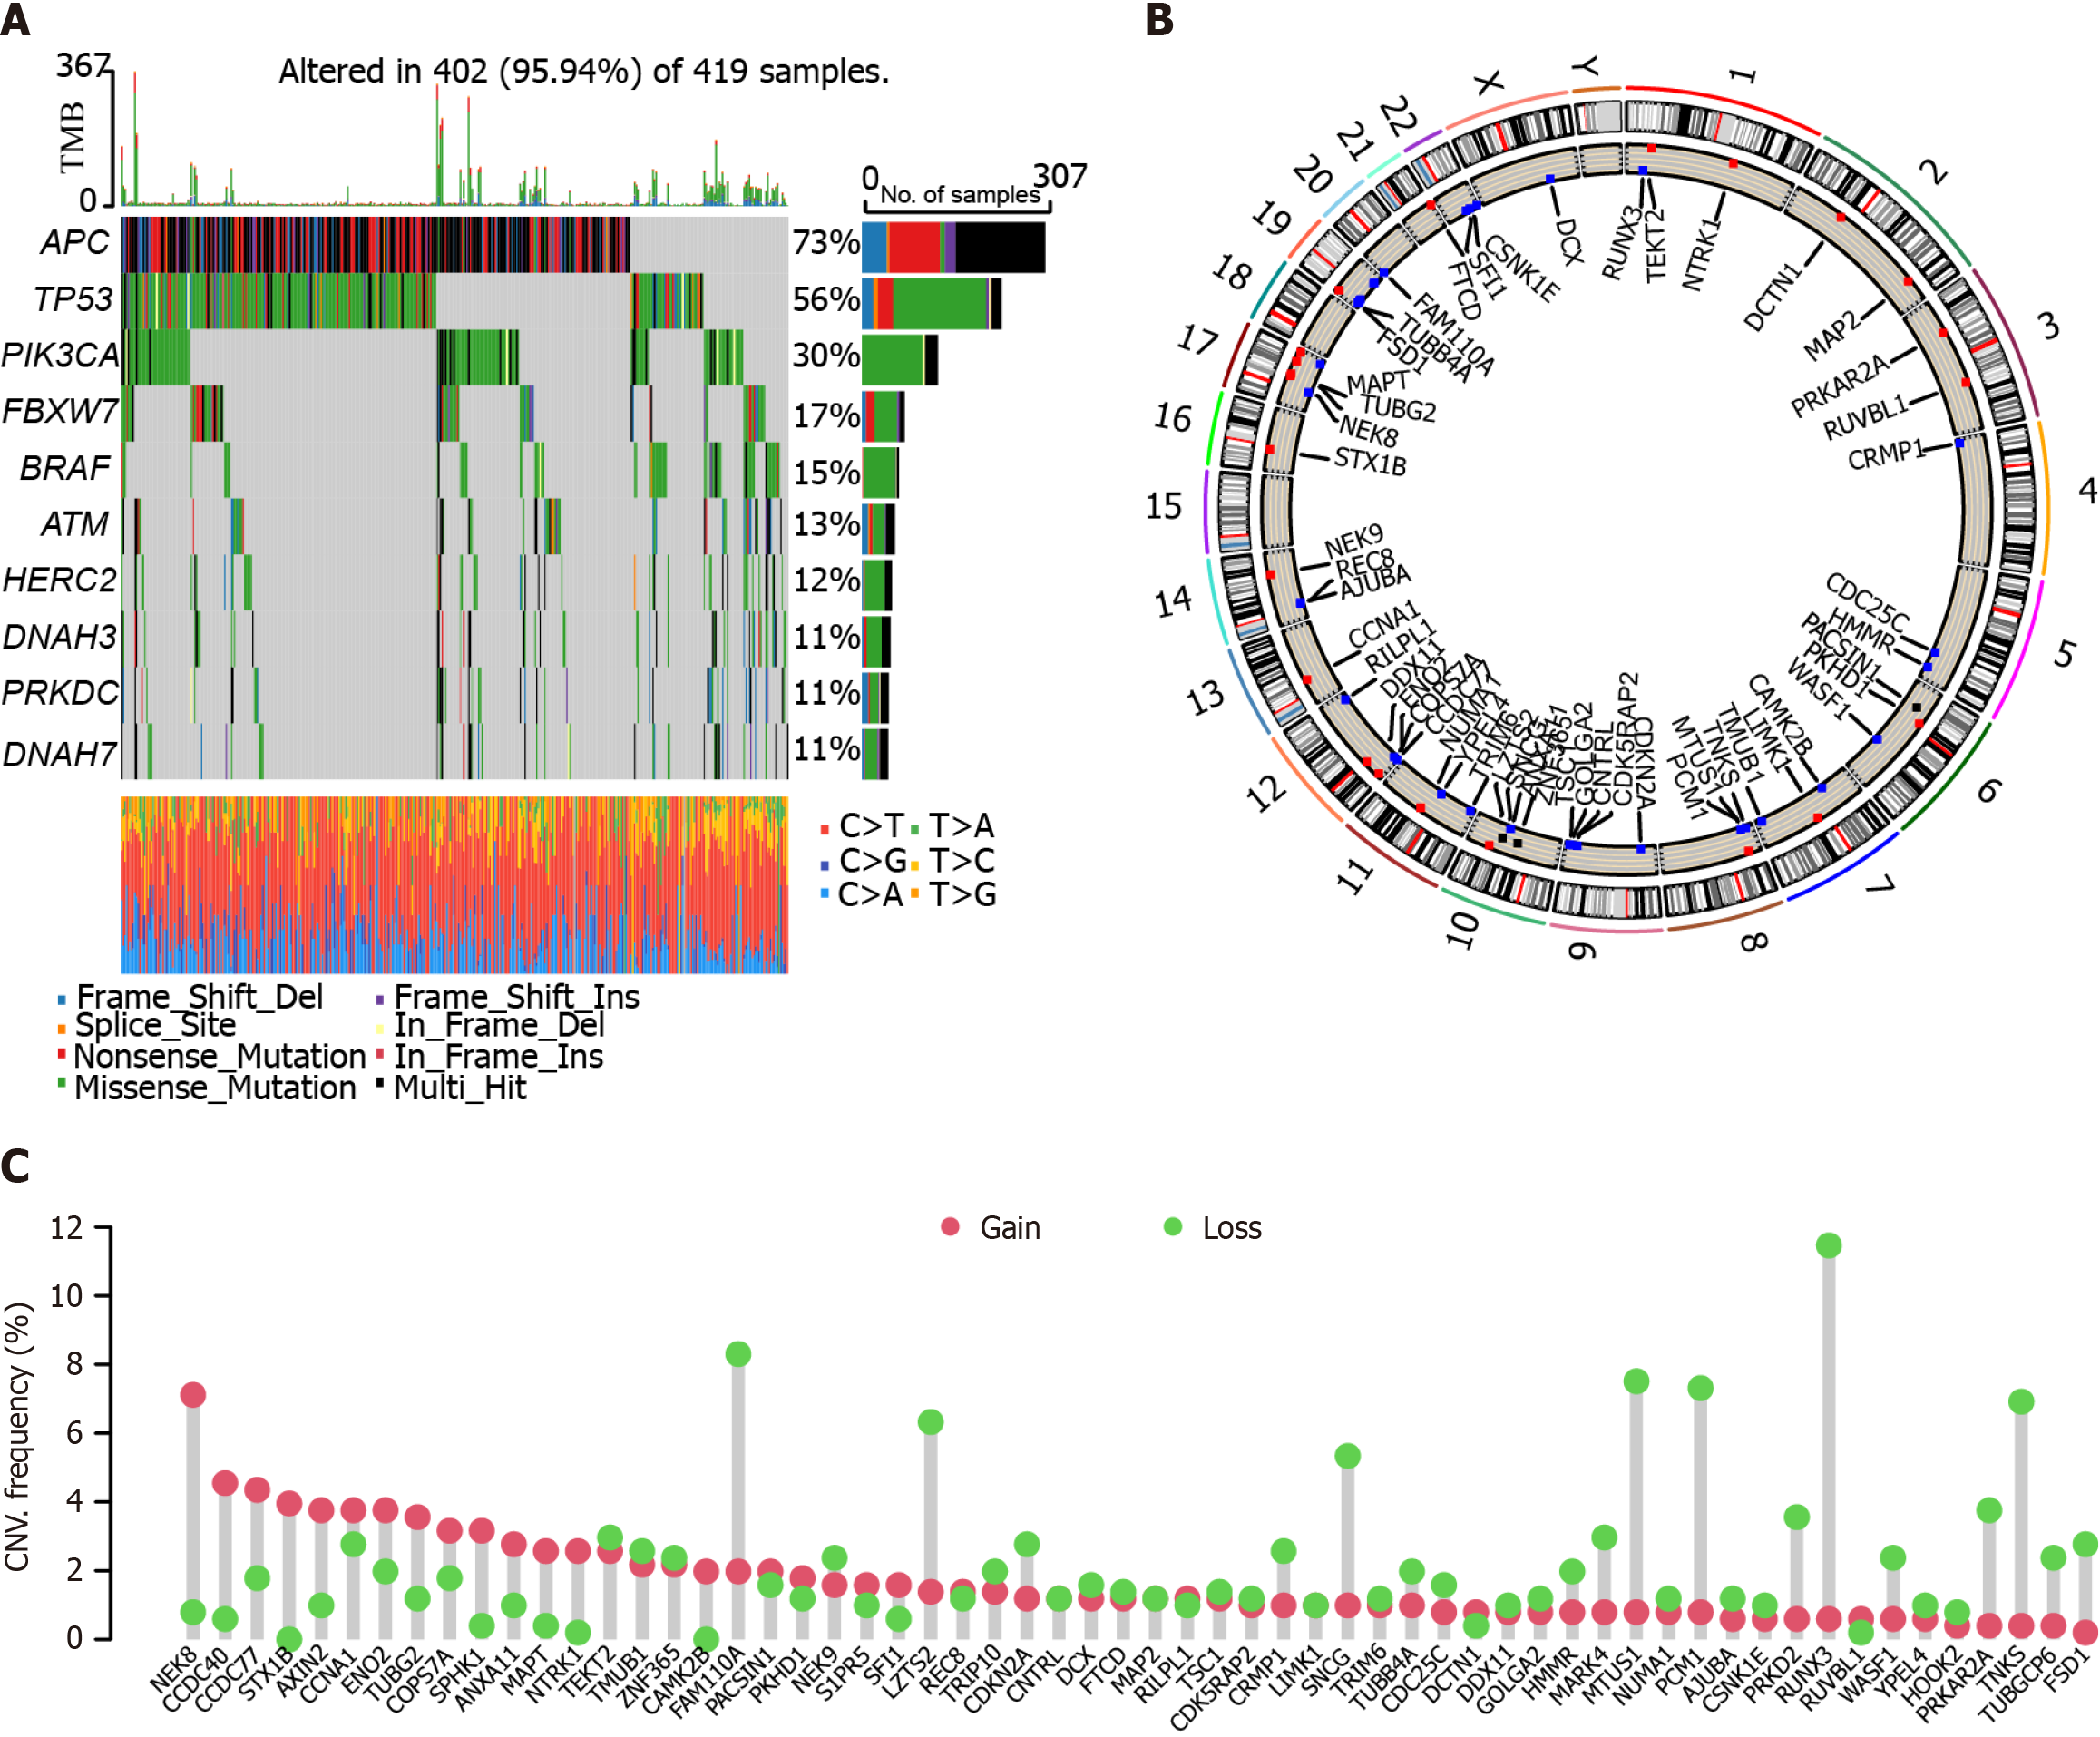
Figure 1 Mutation analysis of the Cancer Genome Atlas-Colon adenocarcinoma cohort.
A: Somatic mutation landscape in the Cancer Genome Atlas-Colon adenocarcinoma (TCGA-COAD) cohort; B: Circus diagram showing the distribution of mutations and genes. The outer circle stands for the chromosomes with labeled band. Red dots refer to the gain in copy number. Blue dots stand for loss in copy number; C: The copy number variation values of genes in the TCGA-COAD cohort. Red dots represent gain, and green dots refer to loss.
- Citation: Wang HY, Diao Y, Tan PZ, Liang H. Four centrosome-related genes to predict the prognosis and drug sensitivity of patients with colon cancer. World J Gastrointest Oncol 2024; 16(5): 1908-1924
- URL: https://www.wjgnet.com/1948-5204/full/v16/i5/1908.htm
- DOI: https://dx.doi.org/10.4251/wjgo.v16.i5.1908


