Copyright
©The Author(s) 2024.
World J Gastrointest Oncol. May 15, 2024; 16(5): 1796-1807
Published online May 15, 2024. doi: 10.4251/wjgo.v16.i5.1796
Published online May 15, 2024. doi: 10.4251/wjgo.v16.i5.1796
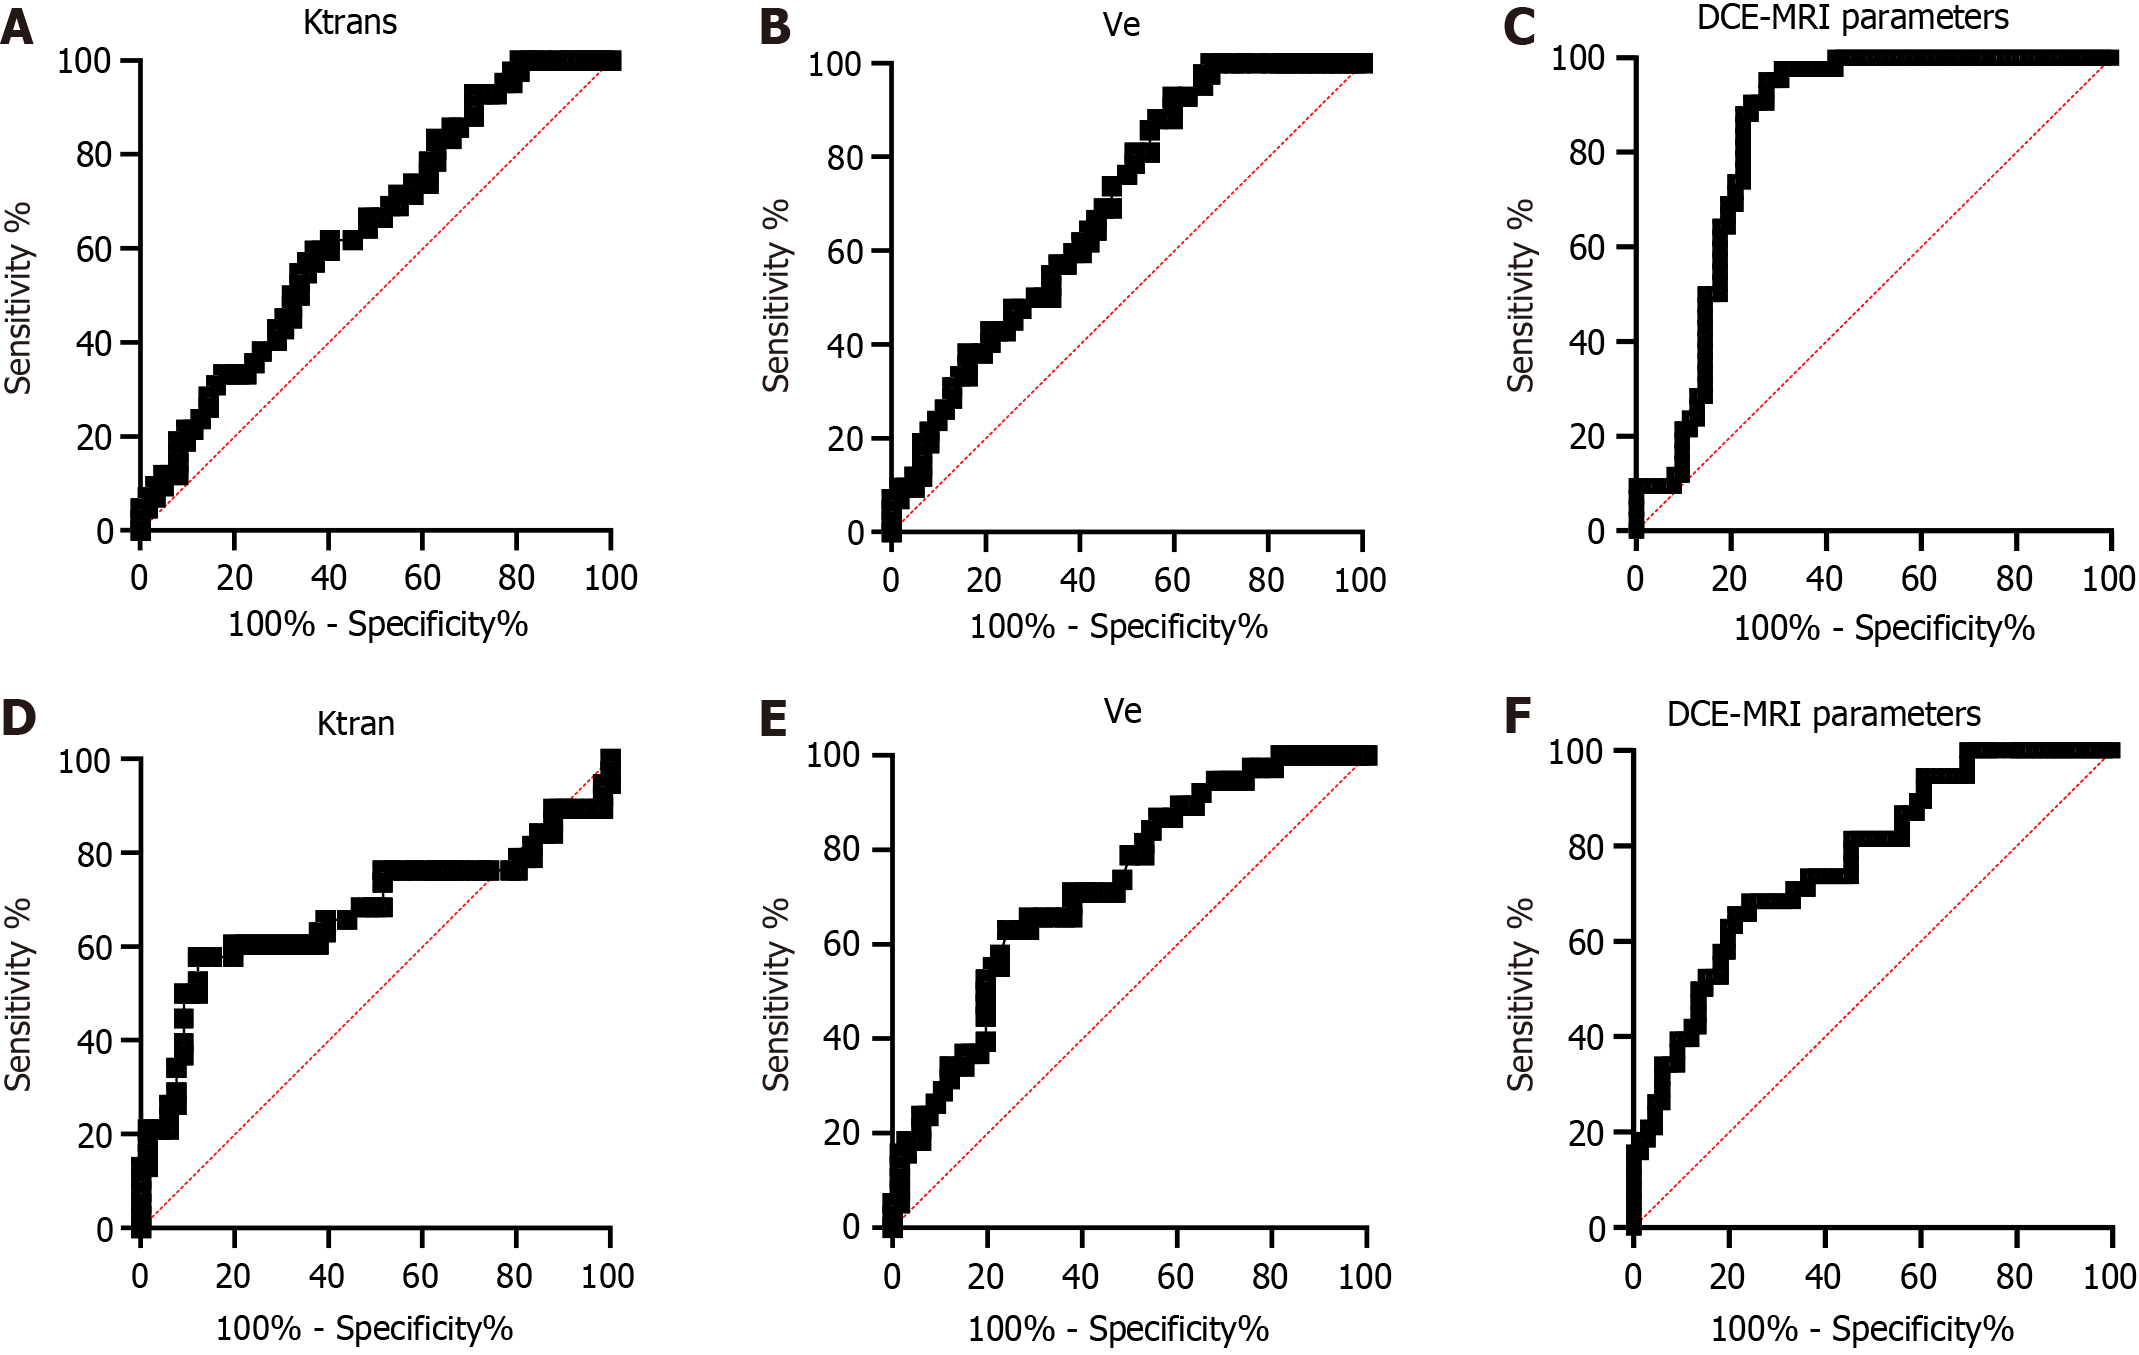
Figure 3 The areas under the curve of dynamic contrast-enhanced magnetic resonance imaging parameters for the diagnosis of T stage and differentiation degree.
A: The areas under the curve (AUC) of volume transfer constant (Ktran) in the diagnosis of high and low stages; B: The AUC of extravascular extracellular volume fraction (Ve) in the diagnosis of high and low stages; C: The AUC of dynamic contrast-enhanced magnetic resonance imaging (DCE-MRI) parameters in the diagnosis of high and low stages; D: The AUC of Ktran in the diagnosis of moderate-high and low differentiation; E: The AUC of Ve in the diagnosis of moderate-high and low differentiation; F: The AUC of DCE-MRI parameters in the diagnosis of moderate-high and low differentiation. Ktrans: Volume transfer constant; Kep: Rate constant; Ve: Extravascular extracellular volume fraction; DCE-MRI: Dynamic contrast-enhanced magnetic resonance imaging.
- Citation: Mu RQ, Lv JW, Ma CY, Ma XH, Xing D, Ma HS. Diagnostic performance of dynamic contrast-enhanced magnetic resonance imaging parameters and serum tumor markers in rectal carcinoma prognosis. World J Gastrointest Oncol 2024; 16(5): 1796-1807
- URL: https://www.wjgnet.com/1948-5204/full/v16/i5/1796.htm
- DOI: https://dx.doi.org/10.4251/wjgo.v16.i5.1796


