Copyright
©The Author(s) 2024.
World J Gastrointest Oncol. Apr 15, 2024; 16(4): 1514-1531
Published online Apr 15, 2024. doi: 10.4251/wjgo.v16.i4.1514
Published online Apr 15, 2024. doi: 10.4251/wjgo.v16.i4.1514
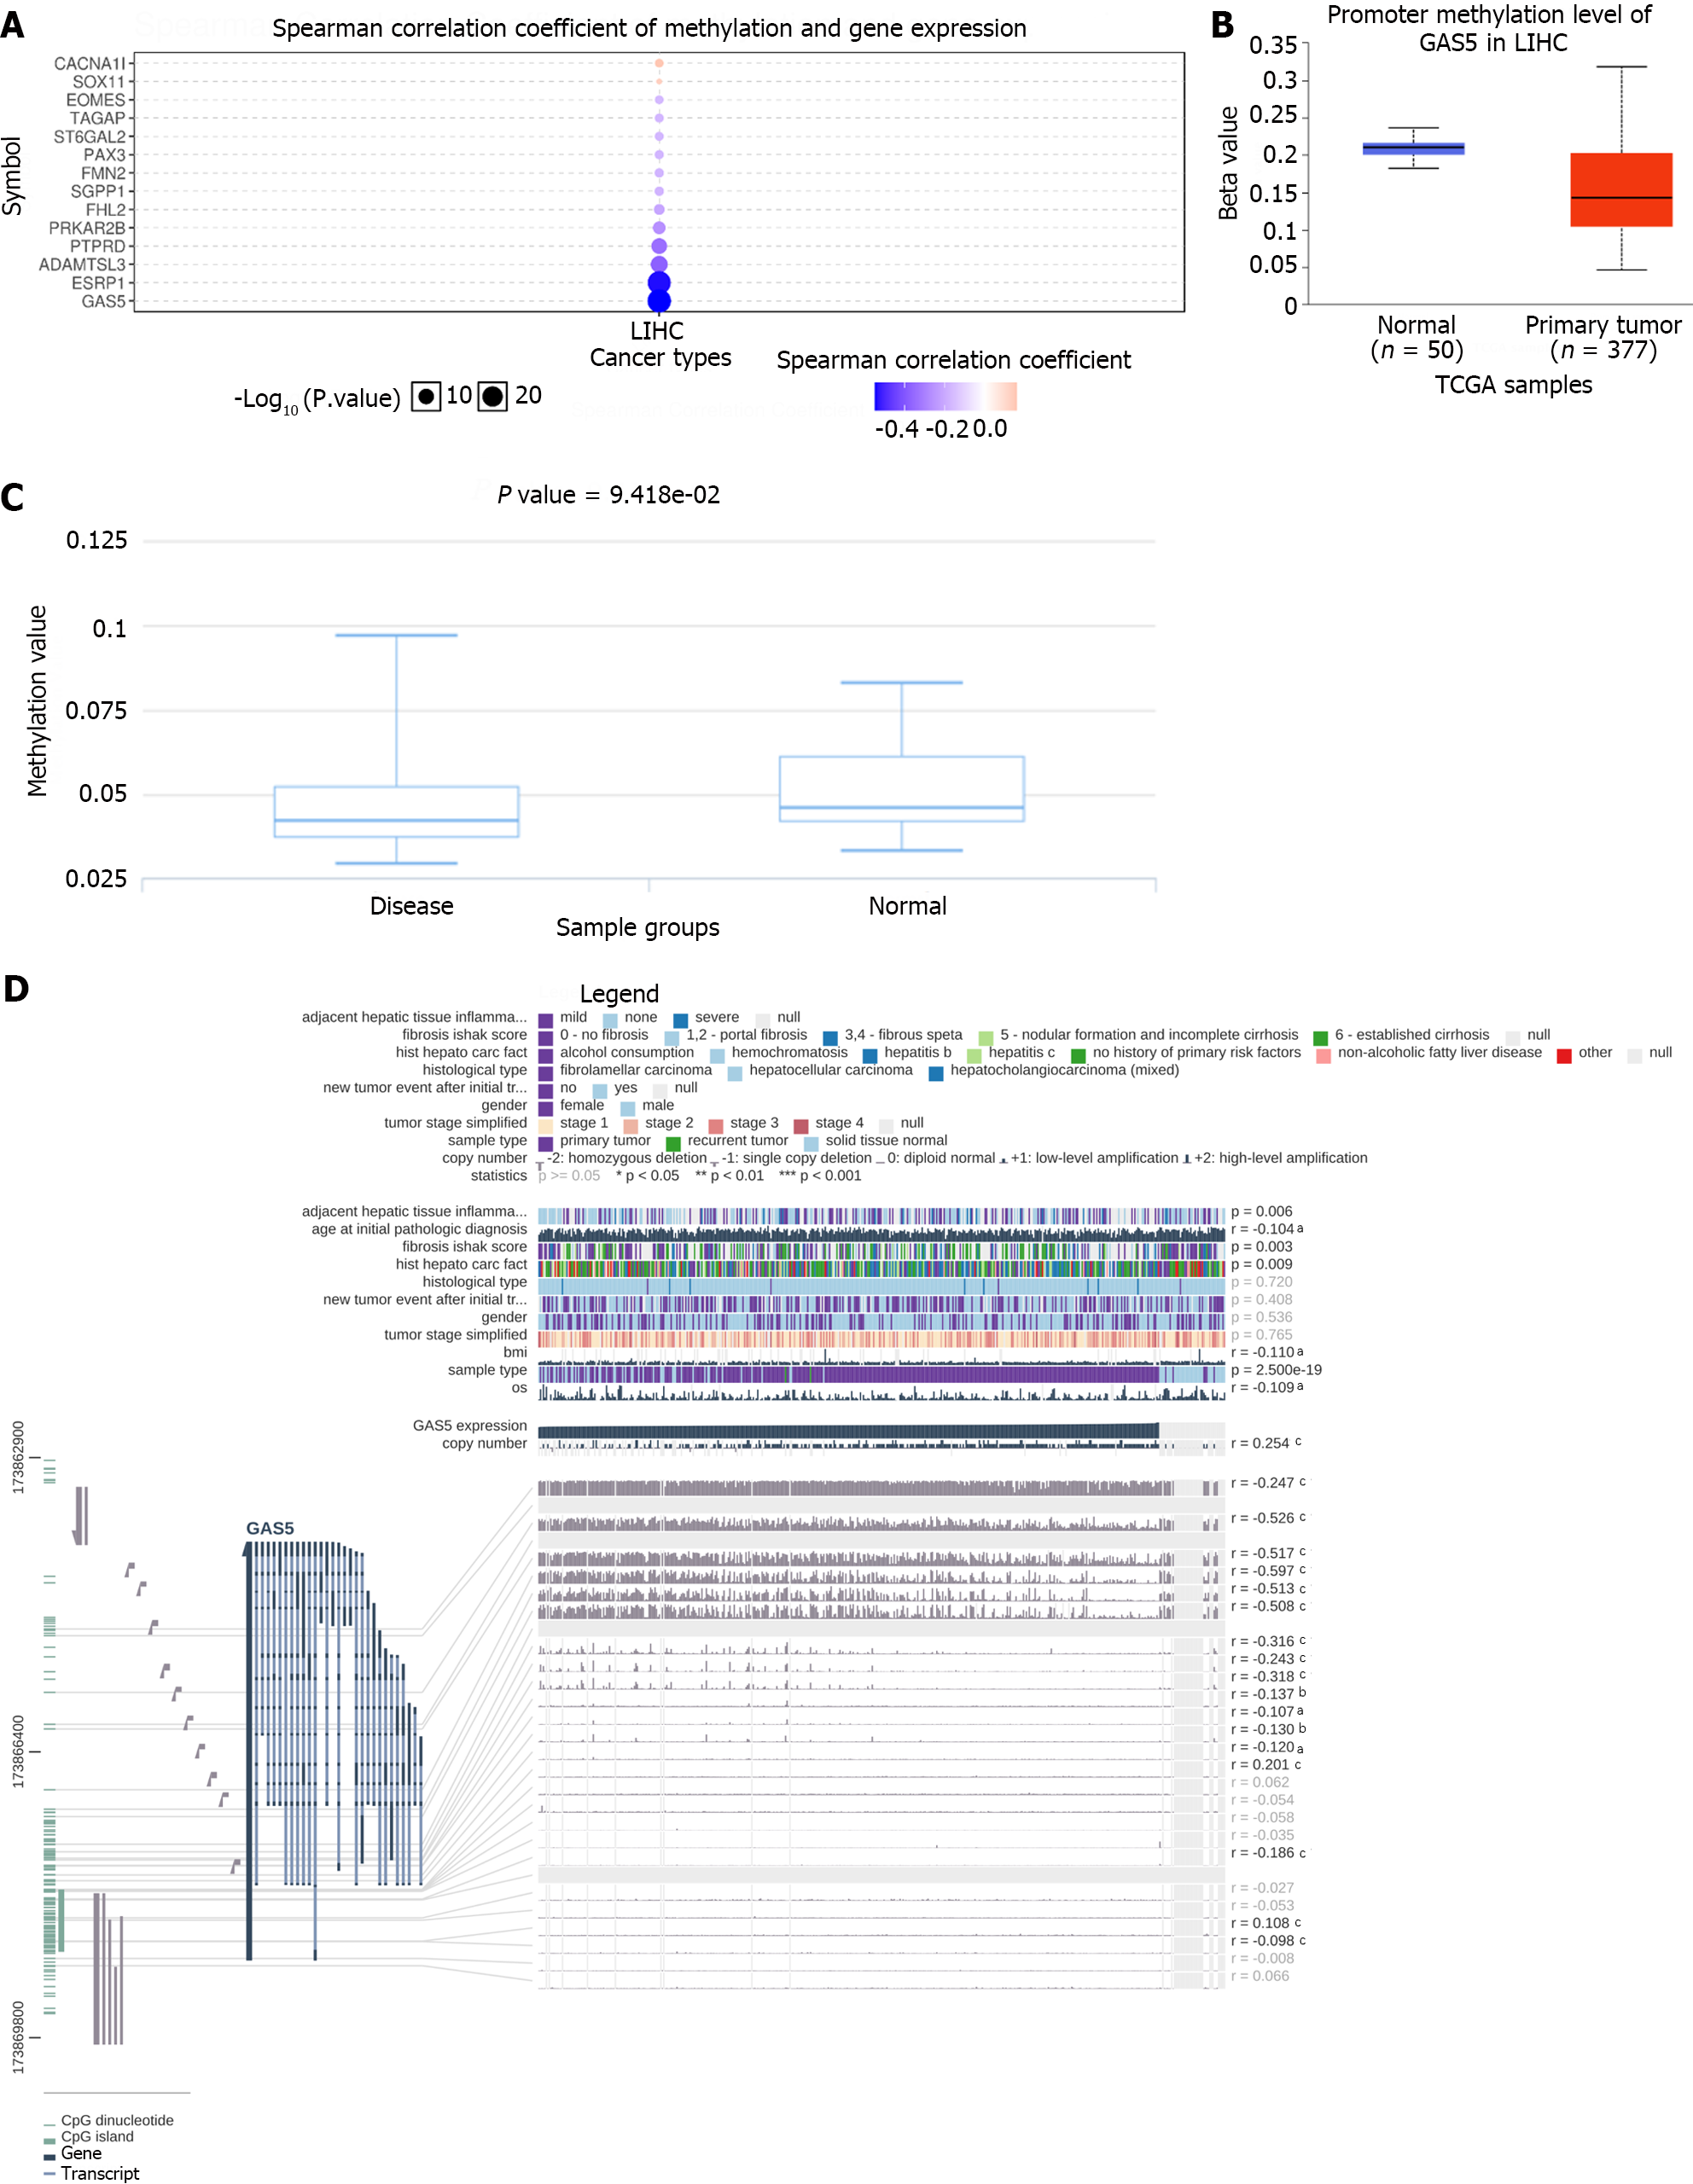
Figure 9 Correlation between methylation and growth arrest-specific 5 expression in hepatocellular carcinoma.
A: Spearman correlation analysis of methylation and expression of growth arrest-specific 5 (GAS5); B: Methylation was evaluated using UALCAN; C: Methylation was assessed using DiseaseMeth version 2.0; D: The methylation site of GAS5 DNA sequence association with gene expression was visualized using MEXPRESS. The expression of GAS5 is illustrated by the blue line in the center of the plot. Pearson’s correlation coefficients and P values for methylation sites and query gene expression are shown on the right side. GAS5: Growth arrest-specific 5.
- Citation: Pan Y, Zhang YR, Wang LY, Wu LN, Ma YQ, Fang Z, Li SB. Construction of CDKN2A-related competitive endogenous RNA network and identification of GAS5 as a prognostic indicator for hepatocellular carcinoma. World J Gastrointest Oncol 2024; 16(4): 1514-1531
- URL: https://www.wjgnet.com/1948-5204/full/v16/i4/1514.htm
- DOI: https://dx.doi.org/10.4251/wjgo.v16.i4.1514


