Copyright
©The Author(s) 2024.
World J Gastrointest Oncol. Apr 15, 2024; 16(4): 1421-1436
Published online Apr 15, 2024. doi: 10.4251/wjgo.v16.i4.1421
Published online Apr 15, 2024. doi: 10.4251/wjgo.v16.i4.1421
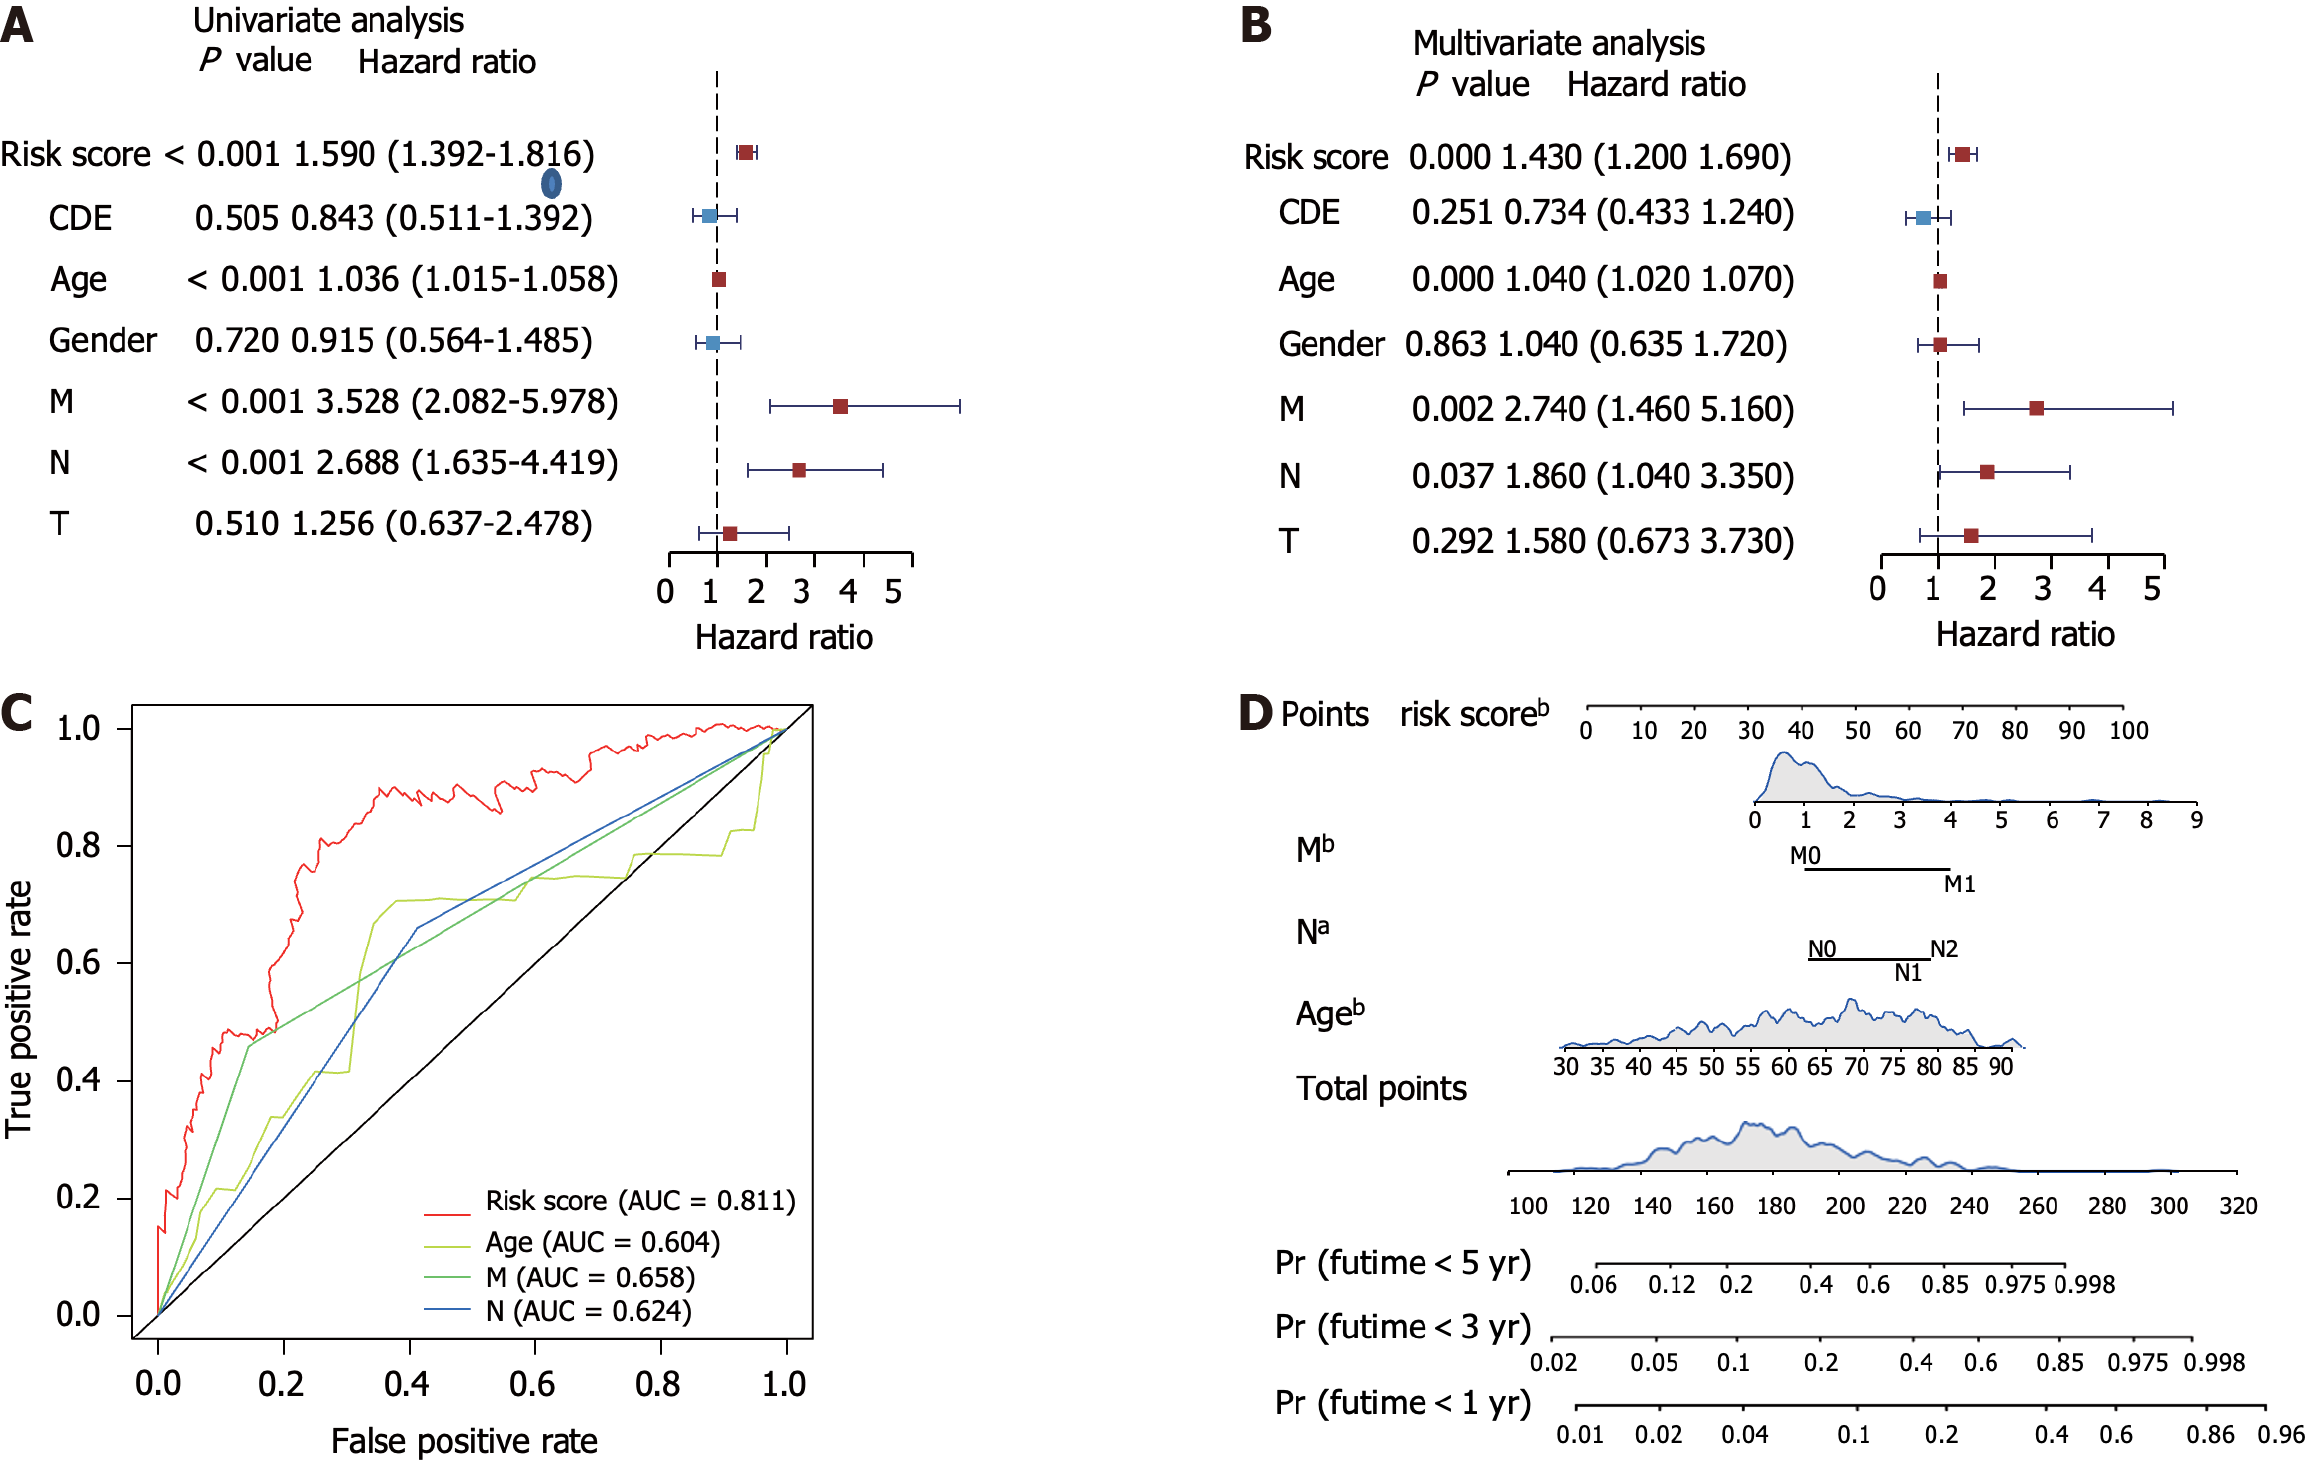
Figure 3 Validation of the risk score and survival prediction model.
A and B: Forest plots showing the univariate and multivariate analysis of risk scores and other clinical parameters; C: Receiver operating characteristic analysis showing the area under curve of each factor for predicting colorectal cancer overall survival; D: Construction of nomogram using the independent risk score. aP < 0.05, bP < 0.01. AUC: Area under curve.
- Citation: Xu YJ, Huo YC, Zhao QT, Liu JY, Tian YJ, Yang LL, Zhang Y. NOX4 promotes tumor progression through the MAPK-MEK1/2-ERK1/2 axis in colorectal cancer. World J Gastrointest Oncol 2024; 16(4): 1421-1436
- URL: https://www.wjgnet.com/1948-5204/full/v16/i4/1421.htm
- DOI: https://dx.doi.org/10.4251/wjgo.v16.i4.1421


