Copyright
©The Author(s) 2024.
World J Gastrointest Oncol. Apr 15, 2024; 16(4): 1344-1360
Published online Apr 15, 2024. doi: 10.4251/wjgo.v16.i4.1344
Published online Apr 15, 2024. doi: 10.4251/wjgo.v16.i4.1344
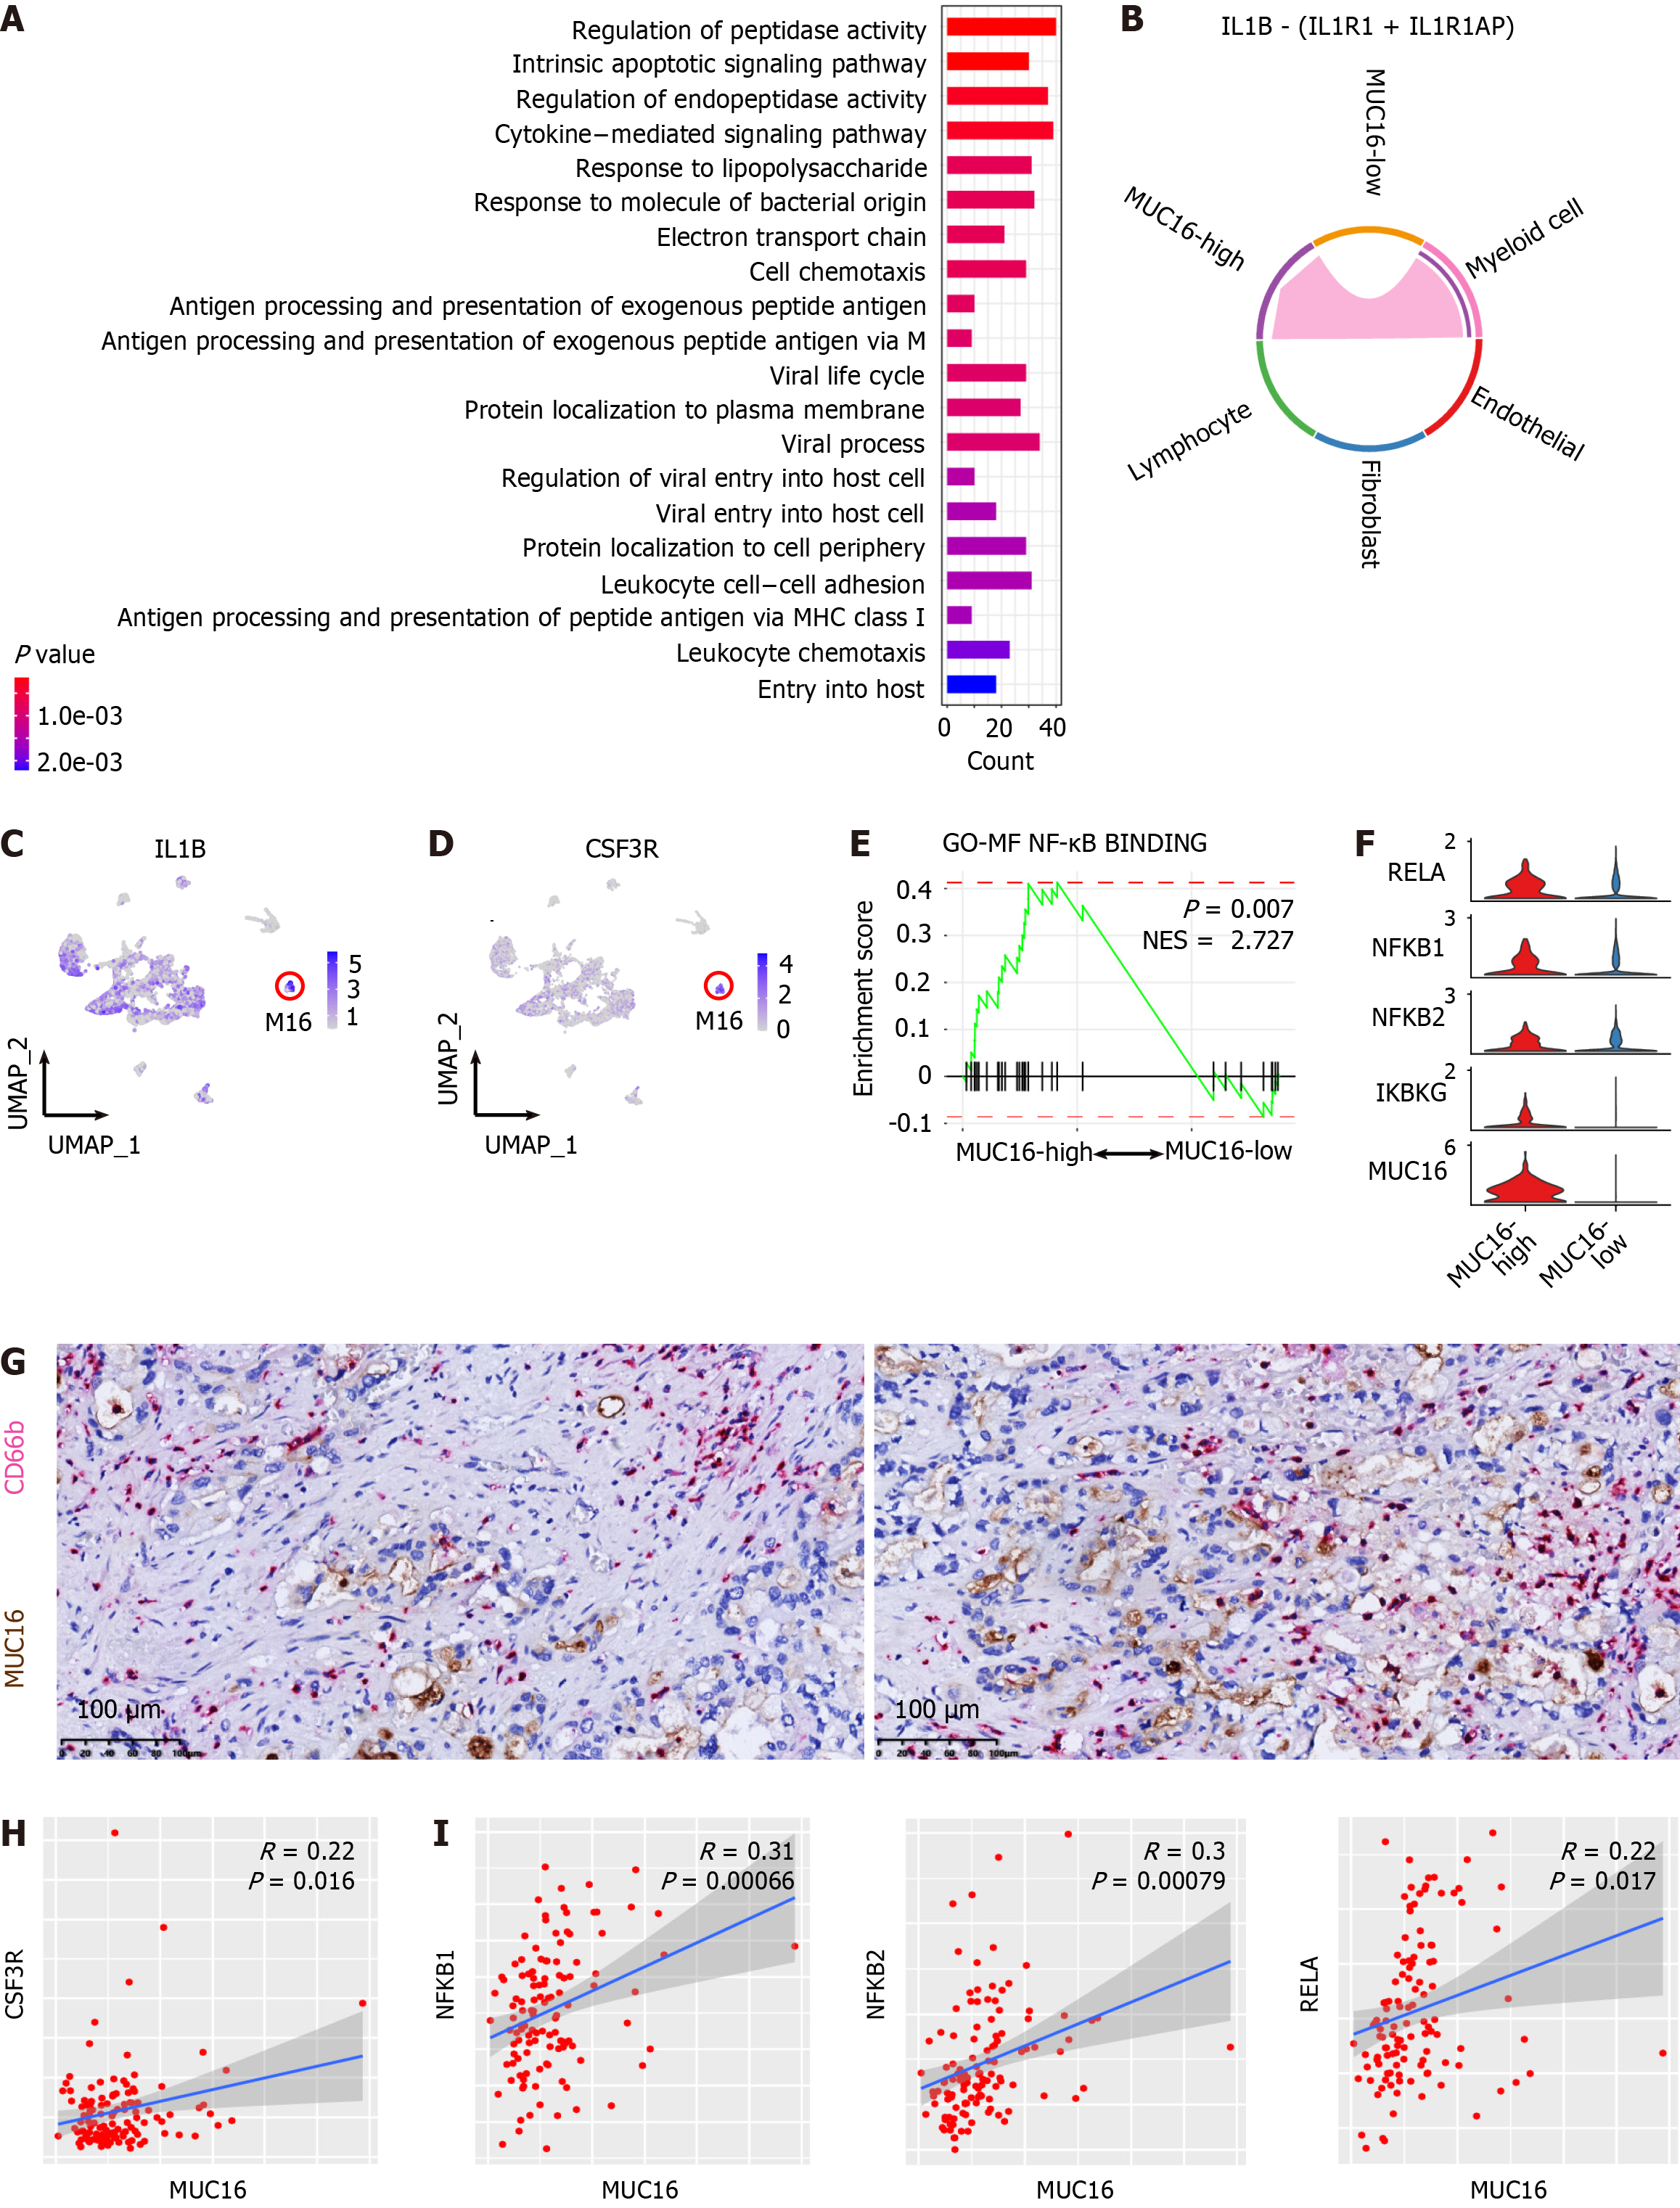
Figure 6 Interaction with neutrophils and activated nuclear factor kappa-light-chain-enhancer of activated B cells signaling in MUC16-high tumor cells of cholangiocarcinoma.
A: Top 20 enriched signaling pathways of the differentially expressed genes of MUC16-high cells; B: Interleukin-1 signaling pathway activity among MUC16-high cells, MUC16-low cells, and cells in tumor microenvironment; C and D: Feature-plots showing the expression level and distribution of IL1B and CSF3R in myeloid cell sub-clusters. Red circles showing the enrichment of IL1B and CSF3R in M16 sub-cluster; E: Gene set enrichment analysis plots showing the enrichment of genes from MUC16-high cells (left) and MUC16-low cells (right) in the nuclear factor kappa-light-chain-enhancer of activated B cells (NF-κB) signaling pathway. The P value and normalized enrichment score are indicated on the plot; F: Violin plots showing relative expression levels of key regulatory genes (RELA, NFKB1, NFKB2, IKBKG) of the NF-κB pathway in MUC16-high vs MUC16-low cells; G: Immunohistochemistry double staining showing the adjacent distribution of MUC16-high cells (MUC16-positive, brown) and neutrophils (CD66b-positive, purple) in cholangiocarcinoma (CCA). Scale bar, 100 μm; H: Correlation analysis between the expression of MUC16 and CSF3R in CCA tumor samples from cohort 10; I: Correlation analysis between the expression of MUC16 and NFKB1, NFKB2, and RELA in CCA tumor samples from cohort 10.
- Citation: Yang CY, Guo LM, Li Y, Wang GX, Tang XW, Zhang QL, Zhang LF, Luo JY. Establishment of a cholangiocarcinoma risk evaluation model based on mucin expression levels. World J Gastrointest Oncol 2024; 16(4): 1344-1360
- URL: https://www.wjgnet.com/1948-5204/full/v16/i4/1344.htm
- DOI: https://dx.doi.org/10.4251/wjgo.v16.i4.1344


