Copyright
©The Author(s) 2024.
World J Gastrointest Oncol. Apr 15, 2024; 16(4): 1344-1360
Published online Apr 15, 2024. doi: 10.4251/wjgo.v16.i4.1344
Published online Apr 15, 2024. doi: 10.4251/wjgo.v16.i4.1344
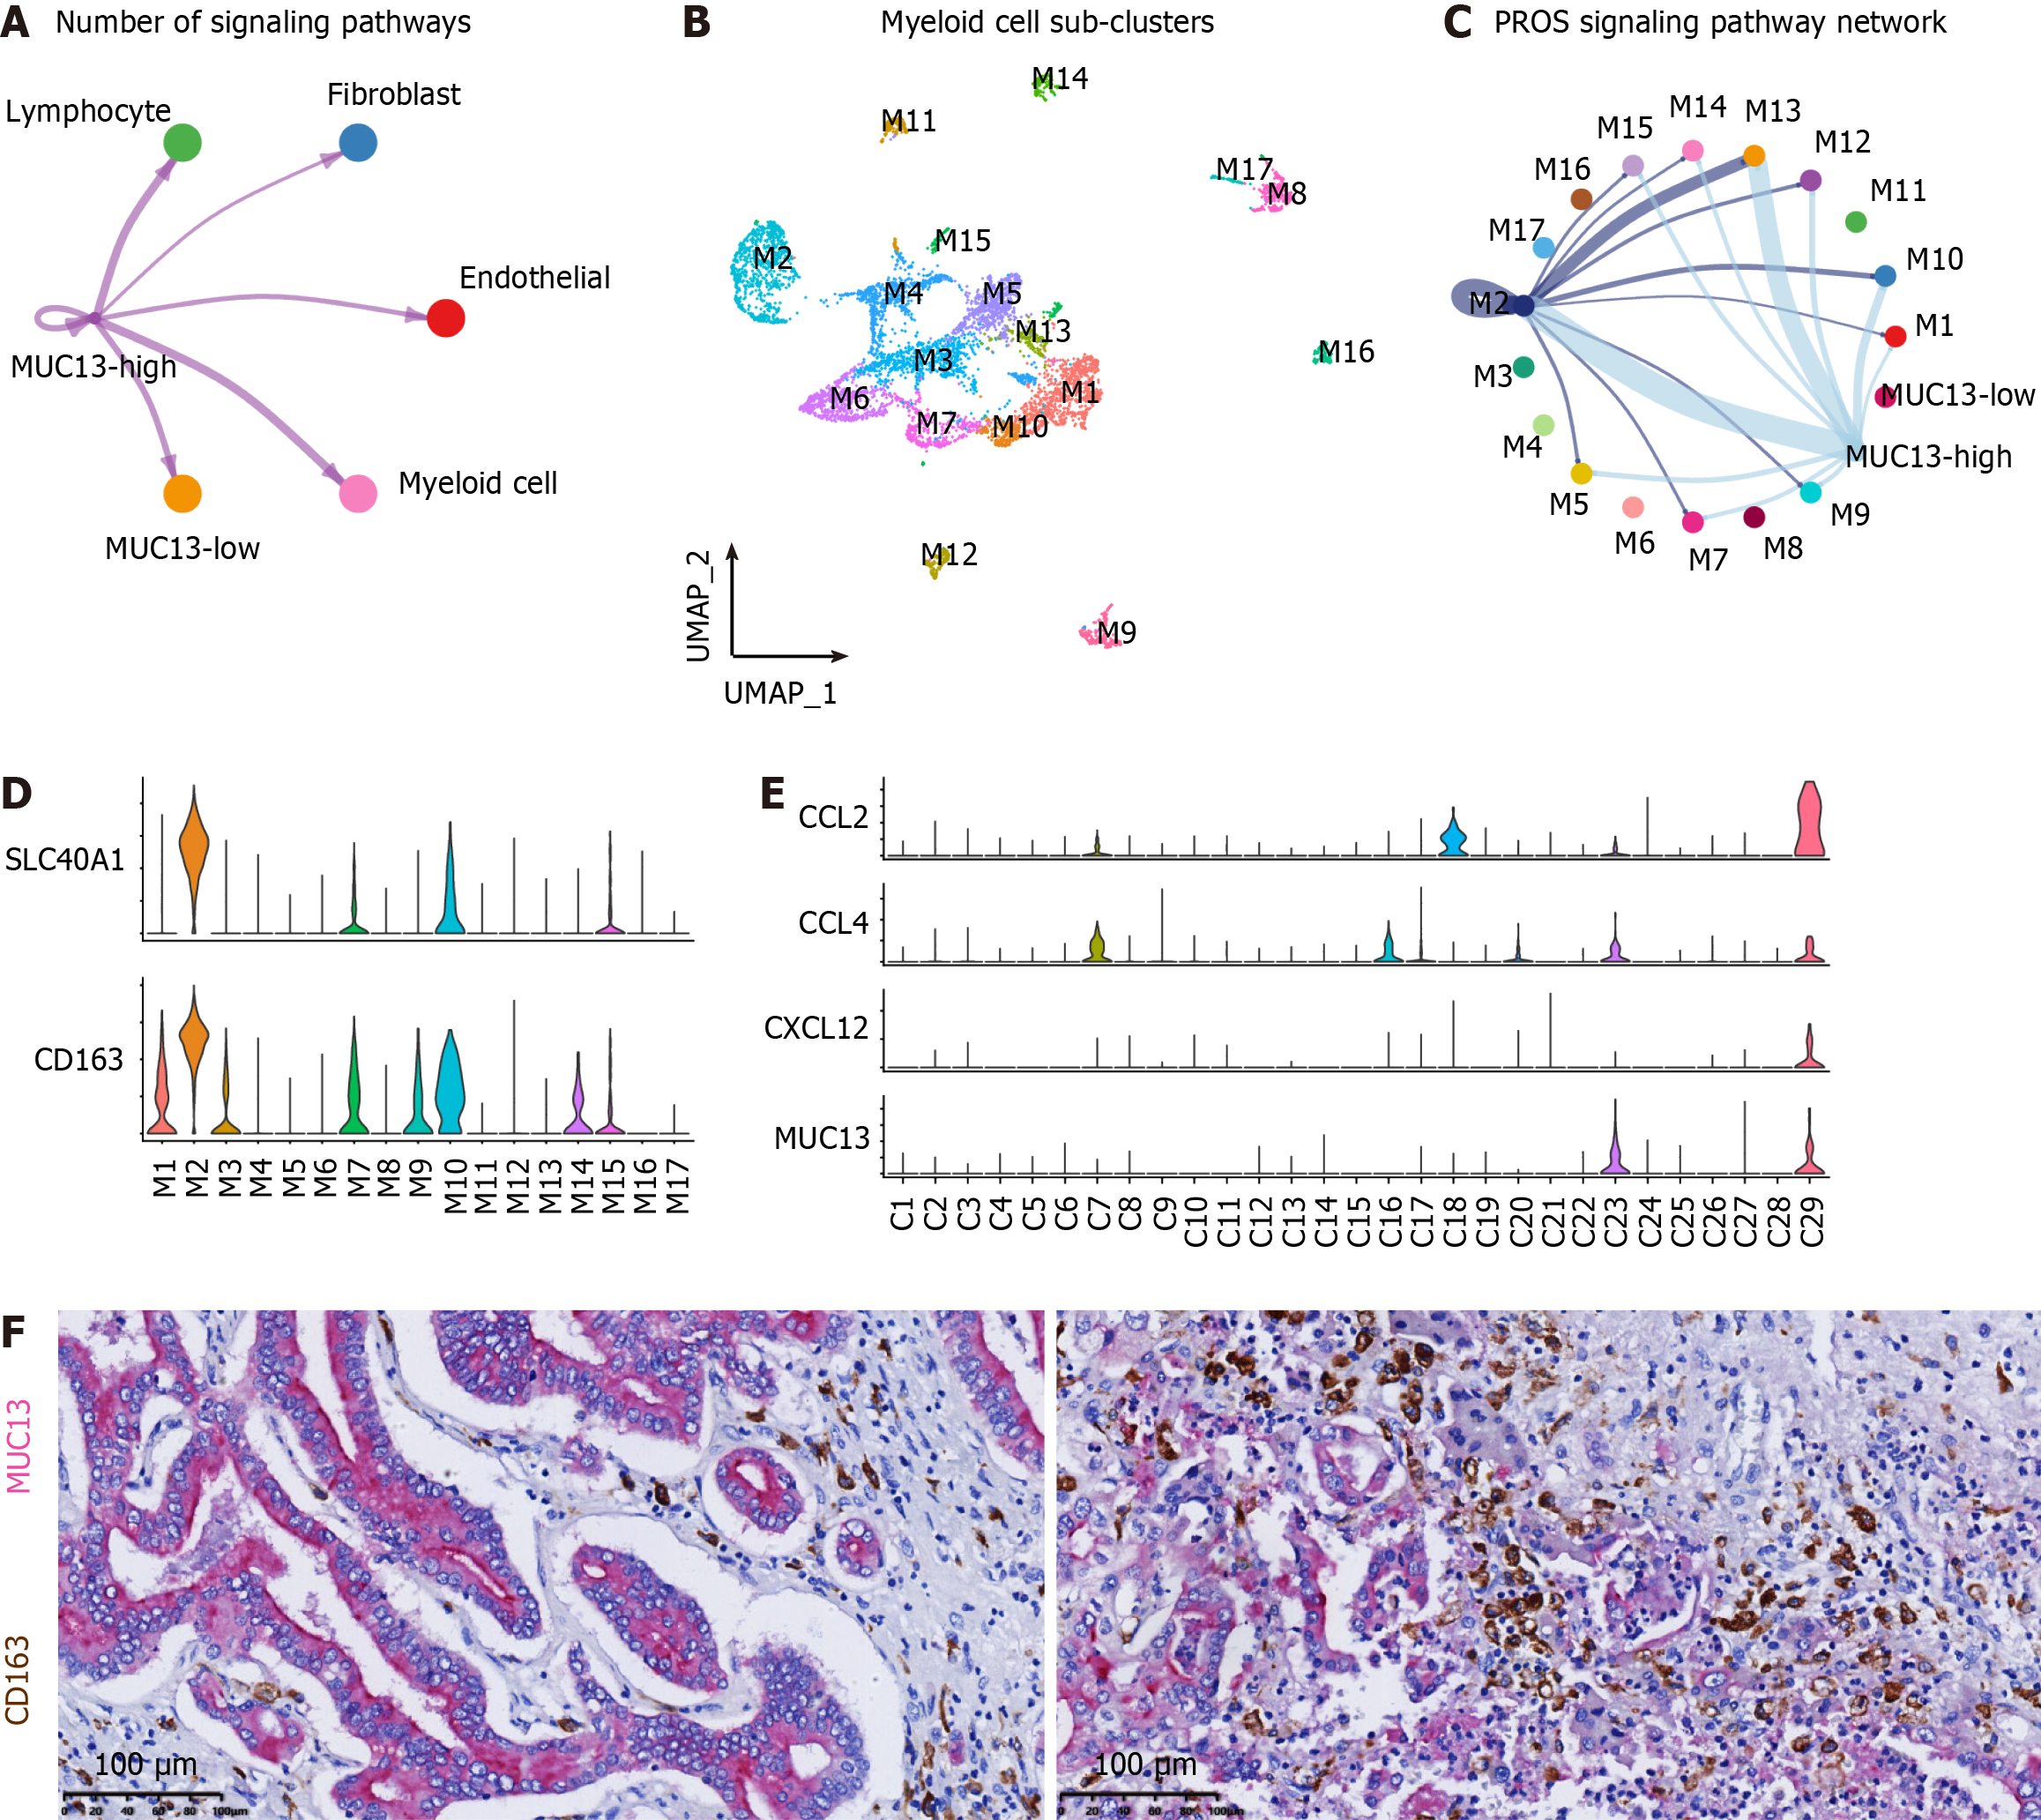
Figure 5 Chemotaxis and M2-polarization of macrophage induced by MUC13-high tumor cells of cholangiocarcinoma.
A: Number of signaling pathways among MUC13-high, MUC13-low, myeloid cells, endothelial cells, fibroblasts, and lymphocytes; B: Uniform manifold approximation and projection plot showing the identification of 17 myeloid cell sub-clusters; C: PROS signaling pathway activity among the MUC13-high sub-cluster, MUC13-low sub-cluster, and myeloid cell sub-clusters; D: Violin plots showing relative expression levels of M2-polarized macrophage marker genes, including SLC40A1 and CD163, in myeloid cell sub-clusters; E: Violin plots showing relative expression levels of CCL2, CCL4, and CXCR12 in tumor cell sub-clusters; F: Immunohistochemistry double staining showing the adjacent distribution of MUC13-high cells (MUC13-positive, purple) and M2-polarized macrophages (CD163-positive, brown) in cholangiocarcinoma. Scale bar, 100 μm.
- Citation: Yang CY, Guo LM, Li Y, Wang GX, Tang XW, Zhang QL, Zhang LF, Luo JY. Establishment of a cholangiocarcinoma risk evaluation model based on mucin expression levels. World J Gastrointest Oncol 2024; 16(4): 1344-1360
- URL: https://www.wjgnet.com/1948-5204/full/v16/i4/1344.htm
- DOI: https://dx.doi.org/10.4251/wjgo.v16.i4.1344


