Copyright
©The Author(s) 2024.
World J Gastrointest Oncol. Mar 15, 2024; 16(3): 991-1005
Published online Mar 15, 2024. doi: 10.4251/wjgo.v16.i3.991
Published online Mar 15, 2024. doi: 10.4251/wjgo.v16.i3.991
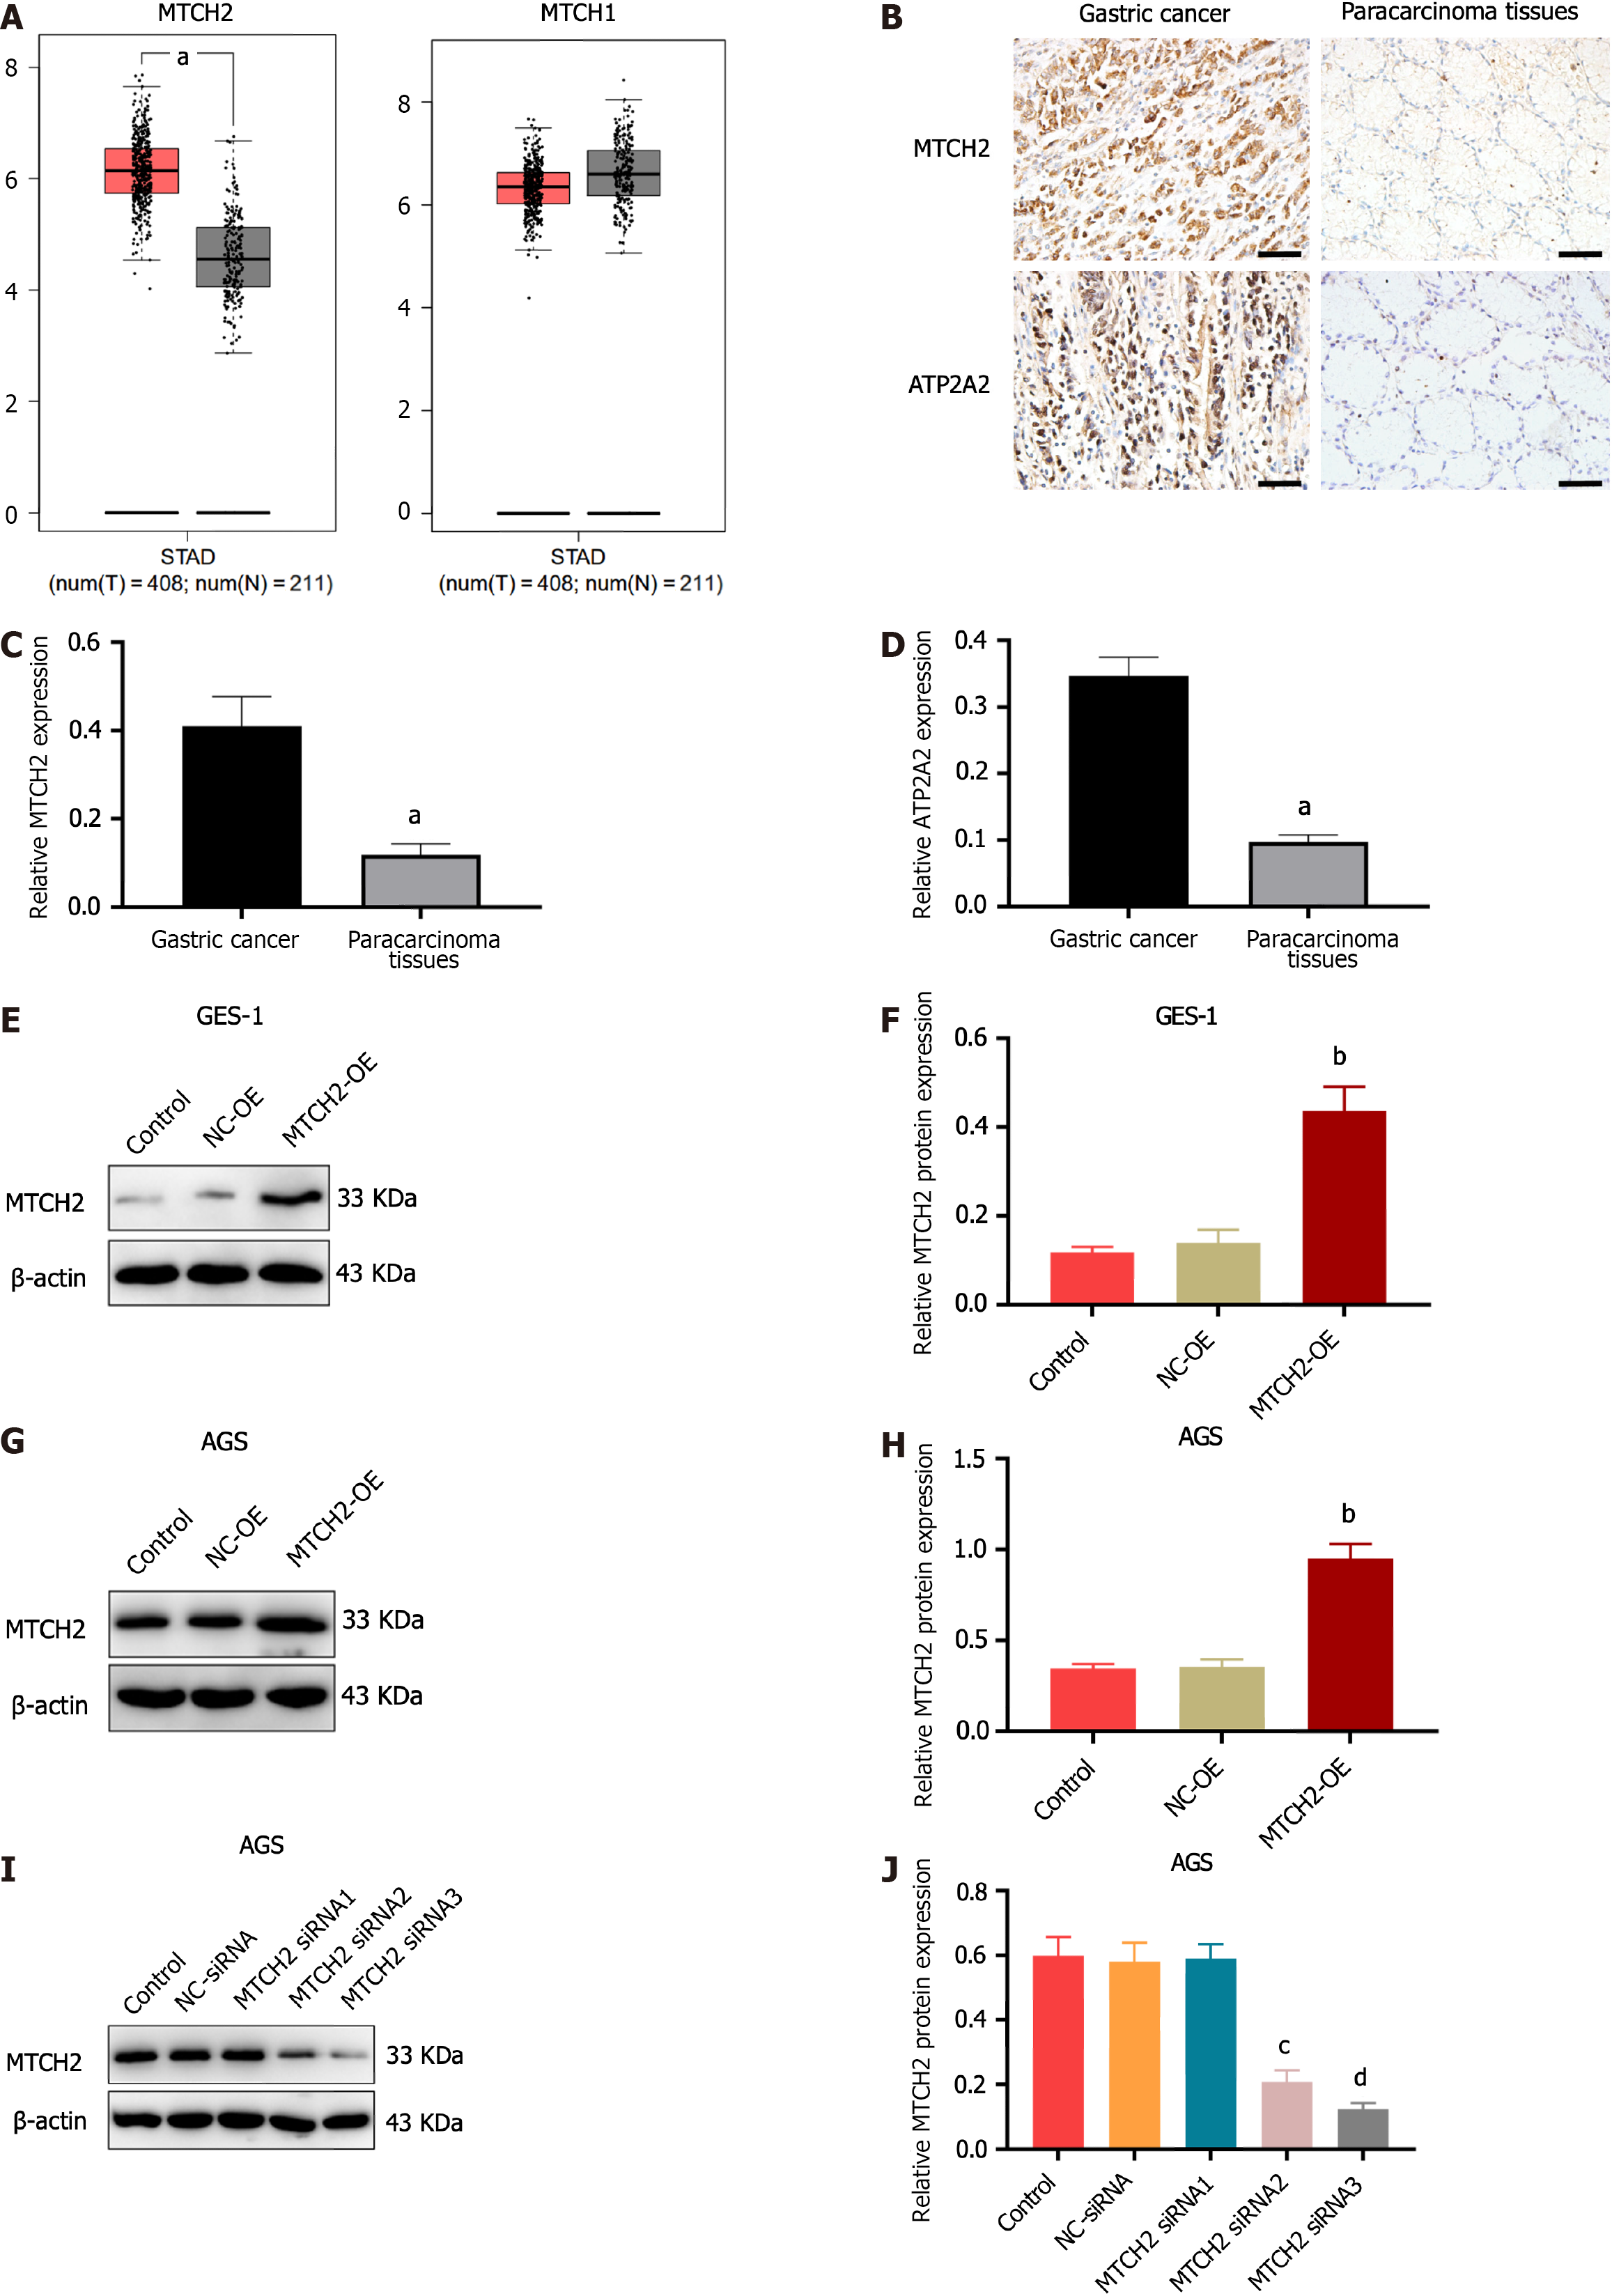
Figure 1 The expression difference of mitochondrial carrier homolog 2 in gastric cancer and paracancer tissues.
A: Gene Expression Profiling Interactive Analysis (GEPIA) was used to analyze the expression of mitochondrial carrier homolog 2 (MTCH2) (left) and MTCH1 (right) in stomach adenocarcinoma; B-D: Expression of MTCH2 and ATP2A2 in gastric cancer tissues and paracarcinoma tissues, n = 65; E-J: MTCH2-OE and MTCH2-siRNA transfection were validated by Western blotting (scale bar: 50 μm). MTCH: Mitochondrial carrier homolog; STAD: Stomach adenocarcinoma; GES-1: Human gastric epithelial cells; AGS: Human gastric cancer cells. aP < 0.001, compared with gastric cancer; bP < 0.001, compared with NC-OE; cP < 0.001, dP < 0.001, compared with NC-siRNA.
- Citation: Zhang JW, Huang LY, Li YN, Tian Y, Yu J, Wang XF. Mitochondrial carrier homolog 2 increases malignant phenotype of human gastric epithelial cells and promotes proliferation, invasion, and migration of gastric cancer cells. World J Gastrointest Oncol 2024; 16(3): 991-1005
- URL: https://www.wjgnet.com/1948-5204/full/v16/i3/991.htm
- DOI: https://dx.doi.org/10.4251/wjgo.v16.i3.991


