Copyright
©The Author(s) 2024.
World J Gastrointest Oncol. Mar 15, 2024; 16(3): 945-967
Published online Mar 15, 2024. doi: 10.4251/wjgo.v16.i3.945
Published online Mar 15, 2024. doi: 10.4251/wjgo.v16.i3.945
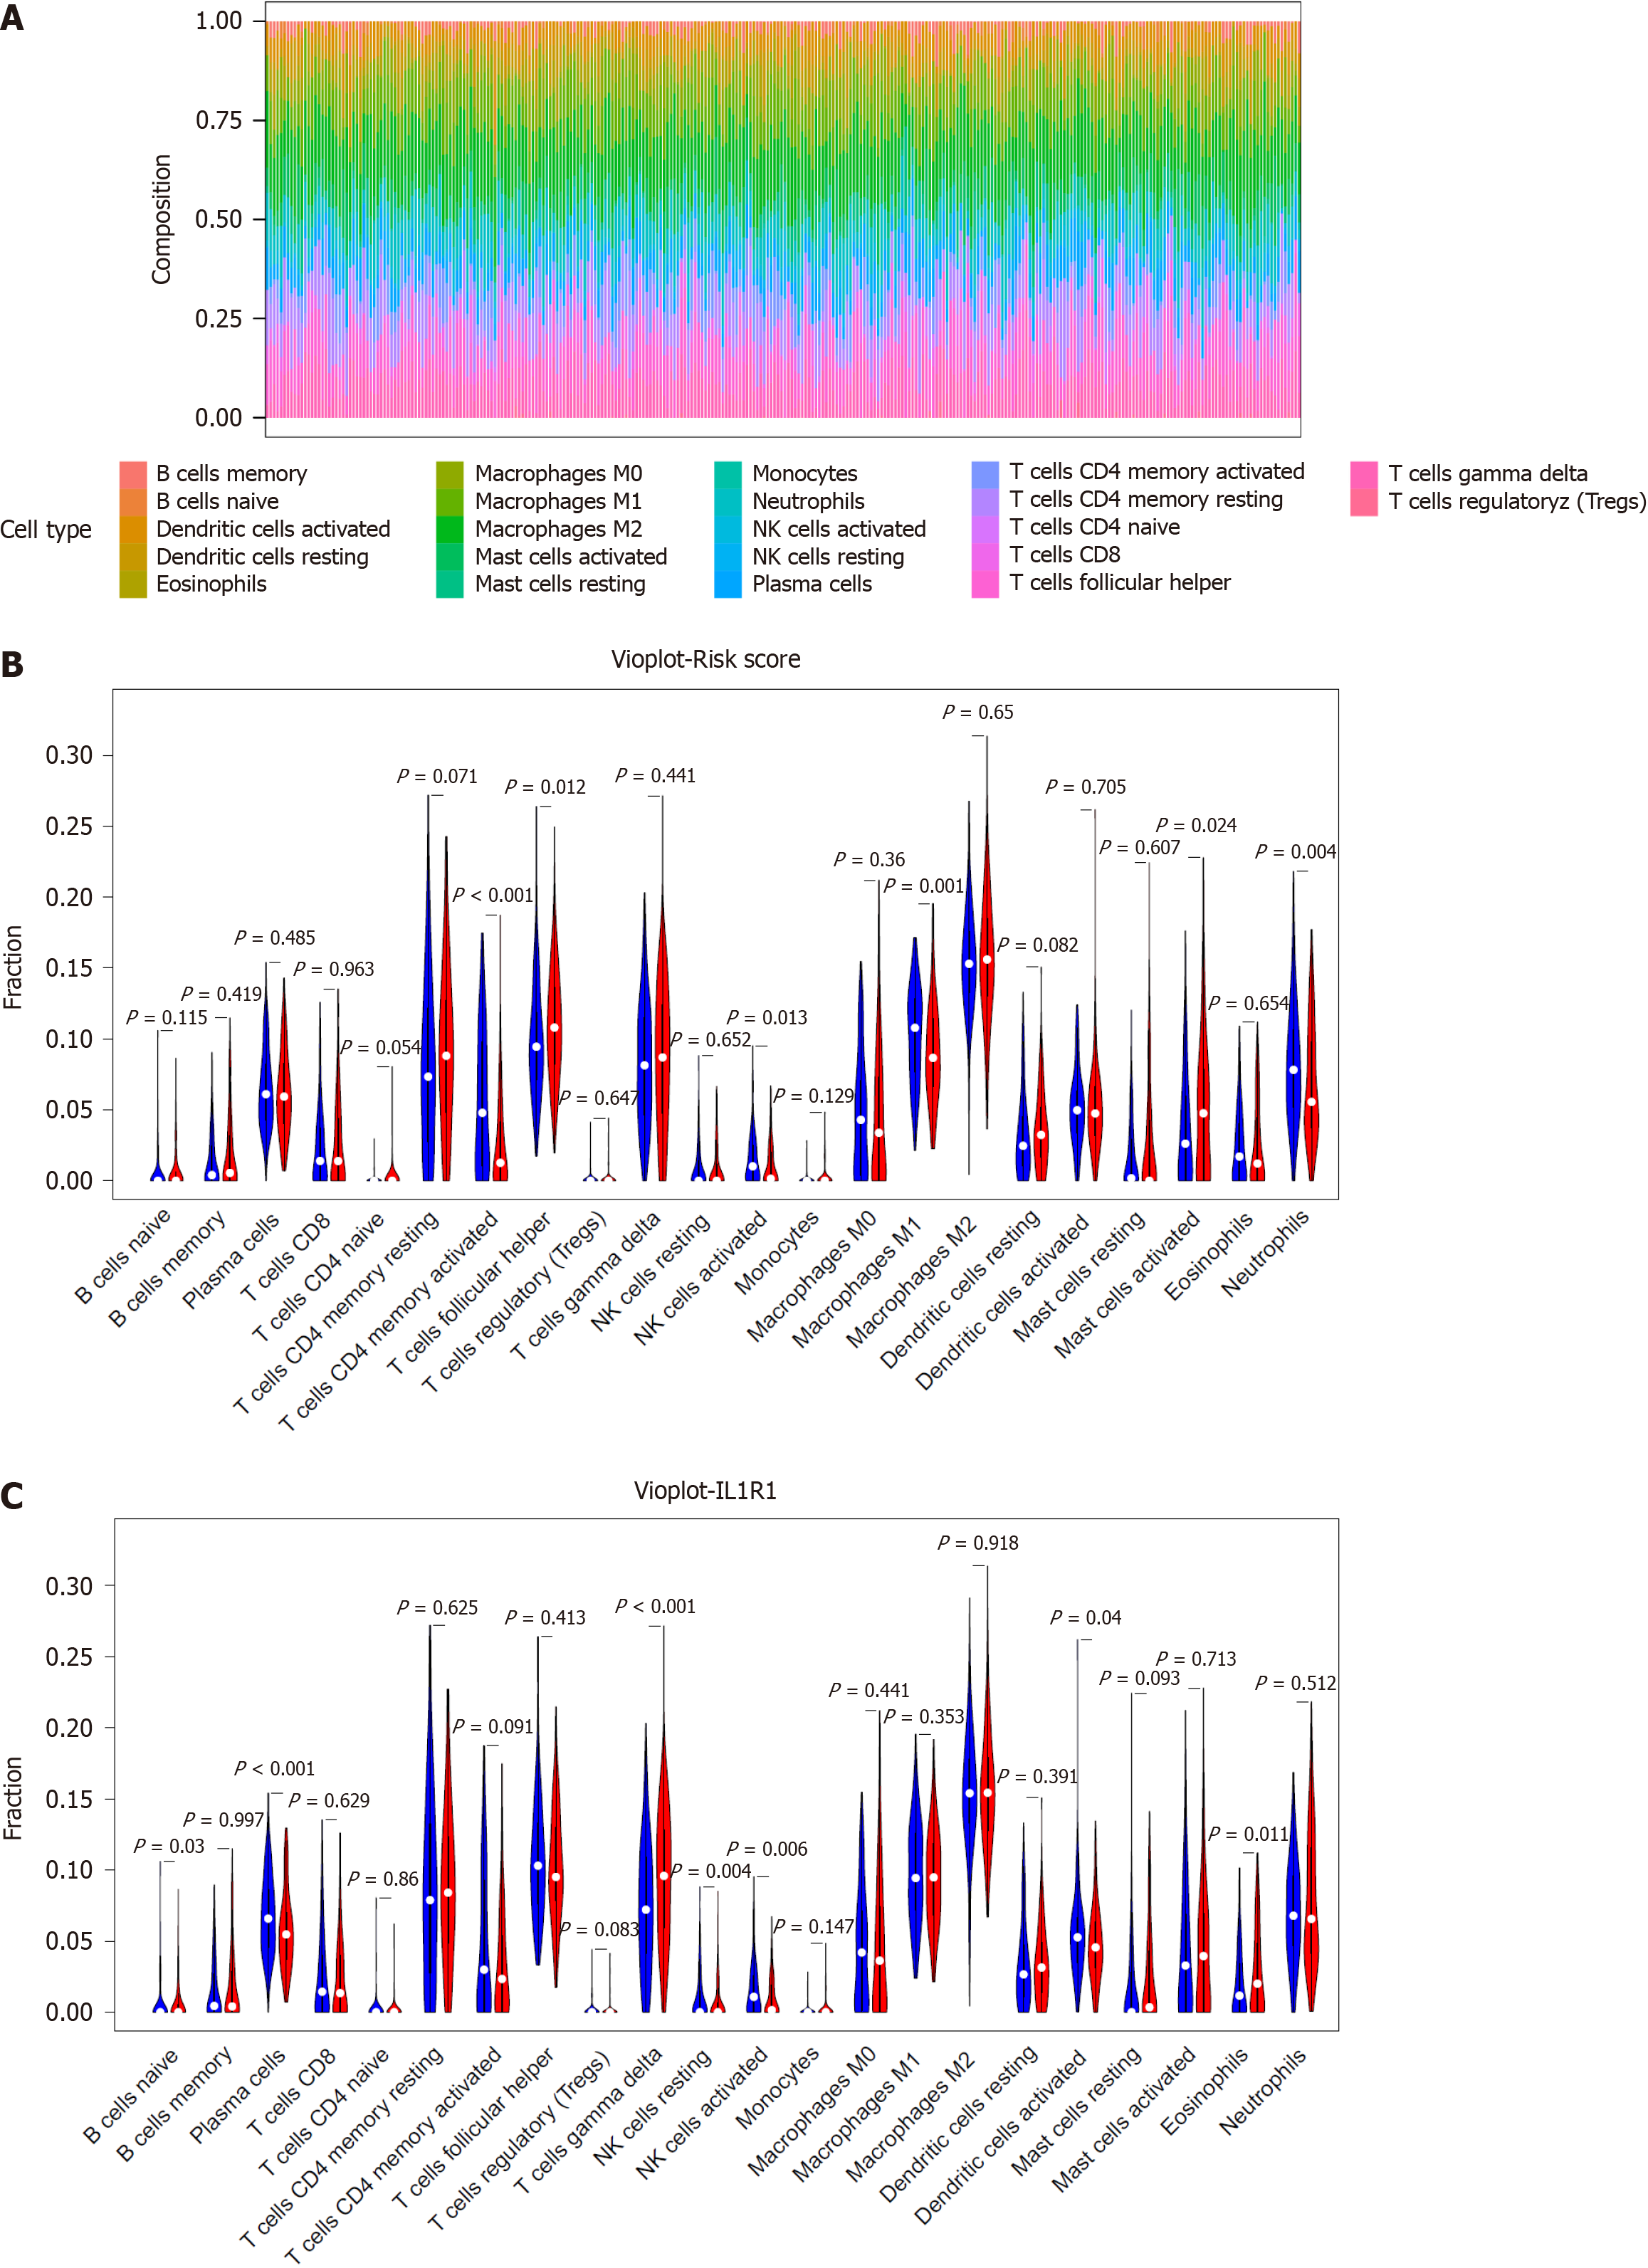
Figure 9 Correlation of the signature with immune cell infiltration.
A: Bar plots of the percentages of 22 immune cell types in the GSE66229-GC cohort. Each cell type is shown in a different colour; B: Violin plot showing the infiltration levels of 22 immune cell types in the low- and high-risk score groups. Blue: low-risk score group; red: high-risk score group; C: Violin plot showing the infiltration levels of 22 immune cell types in the low- and high-ILR1 expression groups. Blue: low-risk score expression group; red: high-risk score group.
- Citation: Hu JL, Huang MJ, Halina H, Qiao K, Wang ZY, Lu JJ, Yin CL, Gao F. Identification of a novel inflammatory-related gene signature to evaluate the prognosis of gastric cancer patients. World J Gastrointest Oncol 2024; 16(3): 945-967
- URL: https://www.wjgnet.com/1948-5204/full/v16/i3/945.htm
- DOI: https://dx.doi.org/10.4251/wjgo.v16.i3.945


