Copyright
©The Author(s) 2024.
World J Gastrointest Oncol. Mar 15, 2024; 16(3): 945-967
Published online Mar 15, 2024. doi: 10.4251/wjgo.v16.i3.945
Published online Mar 15, 2024. doi: 10.4251/wjgo.v16.i3.945
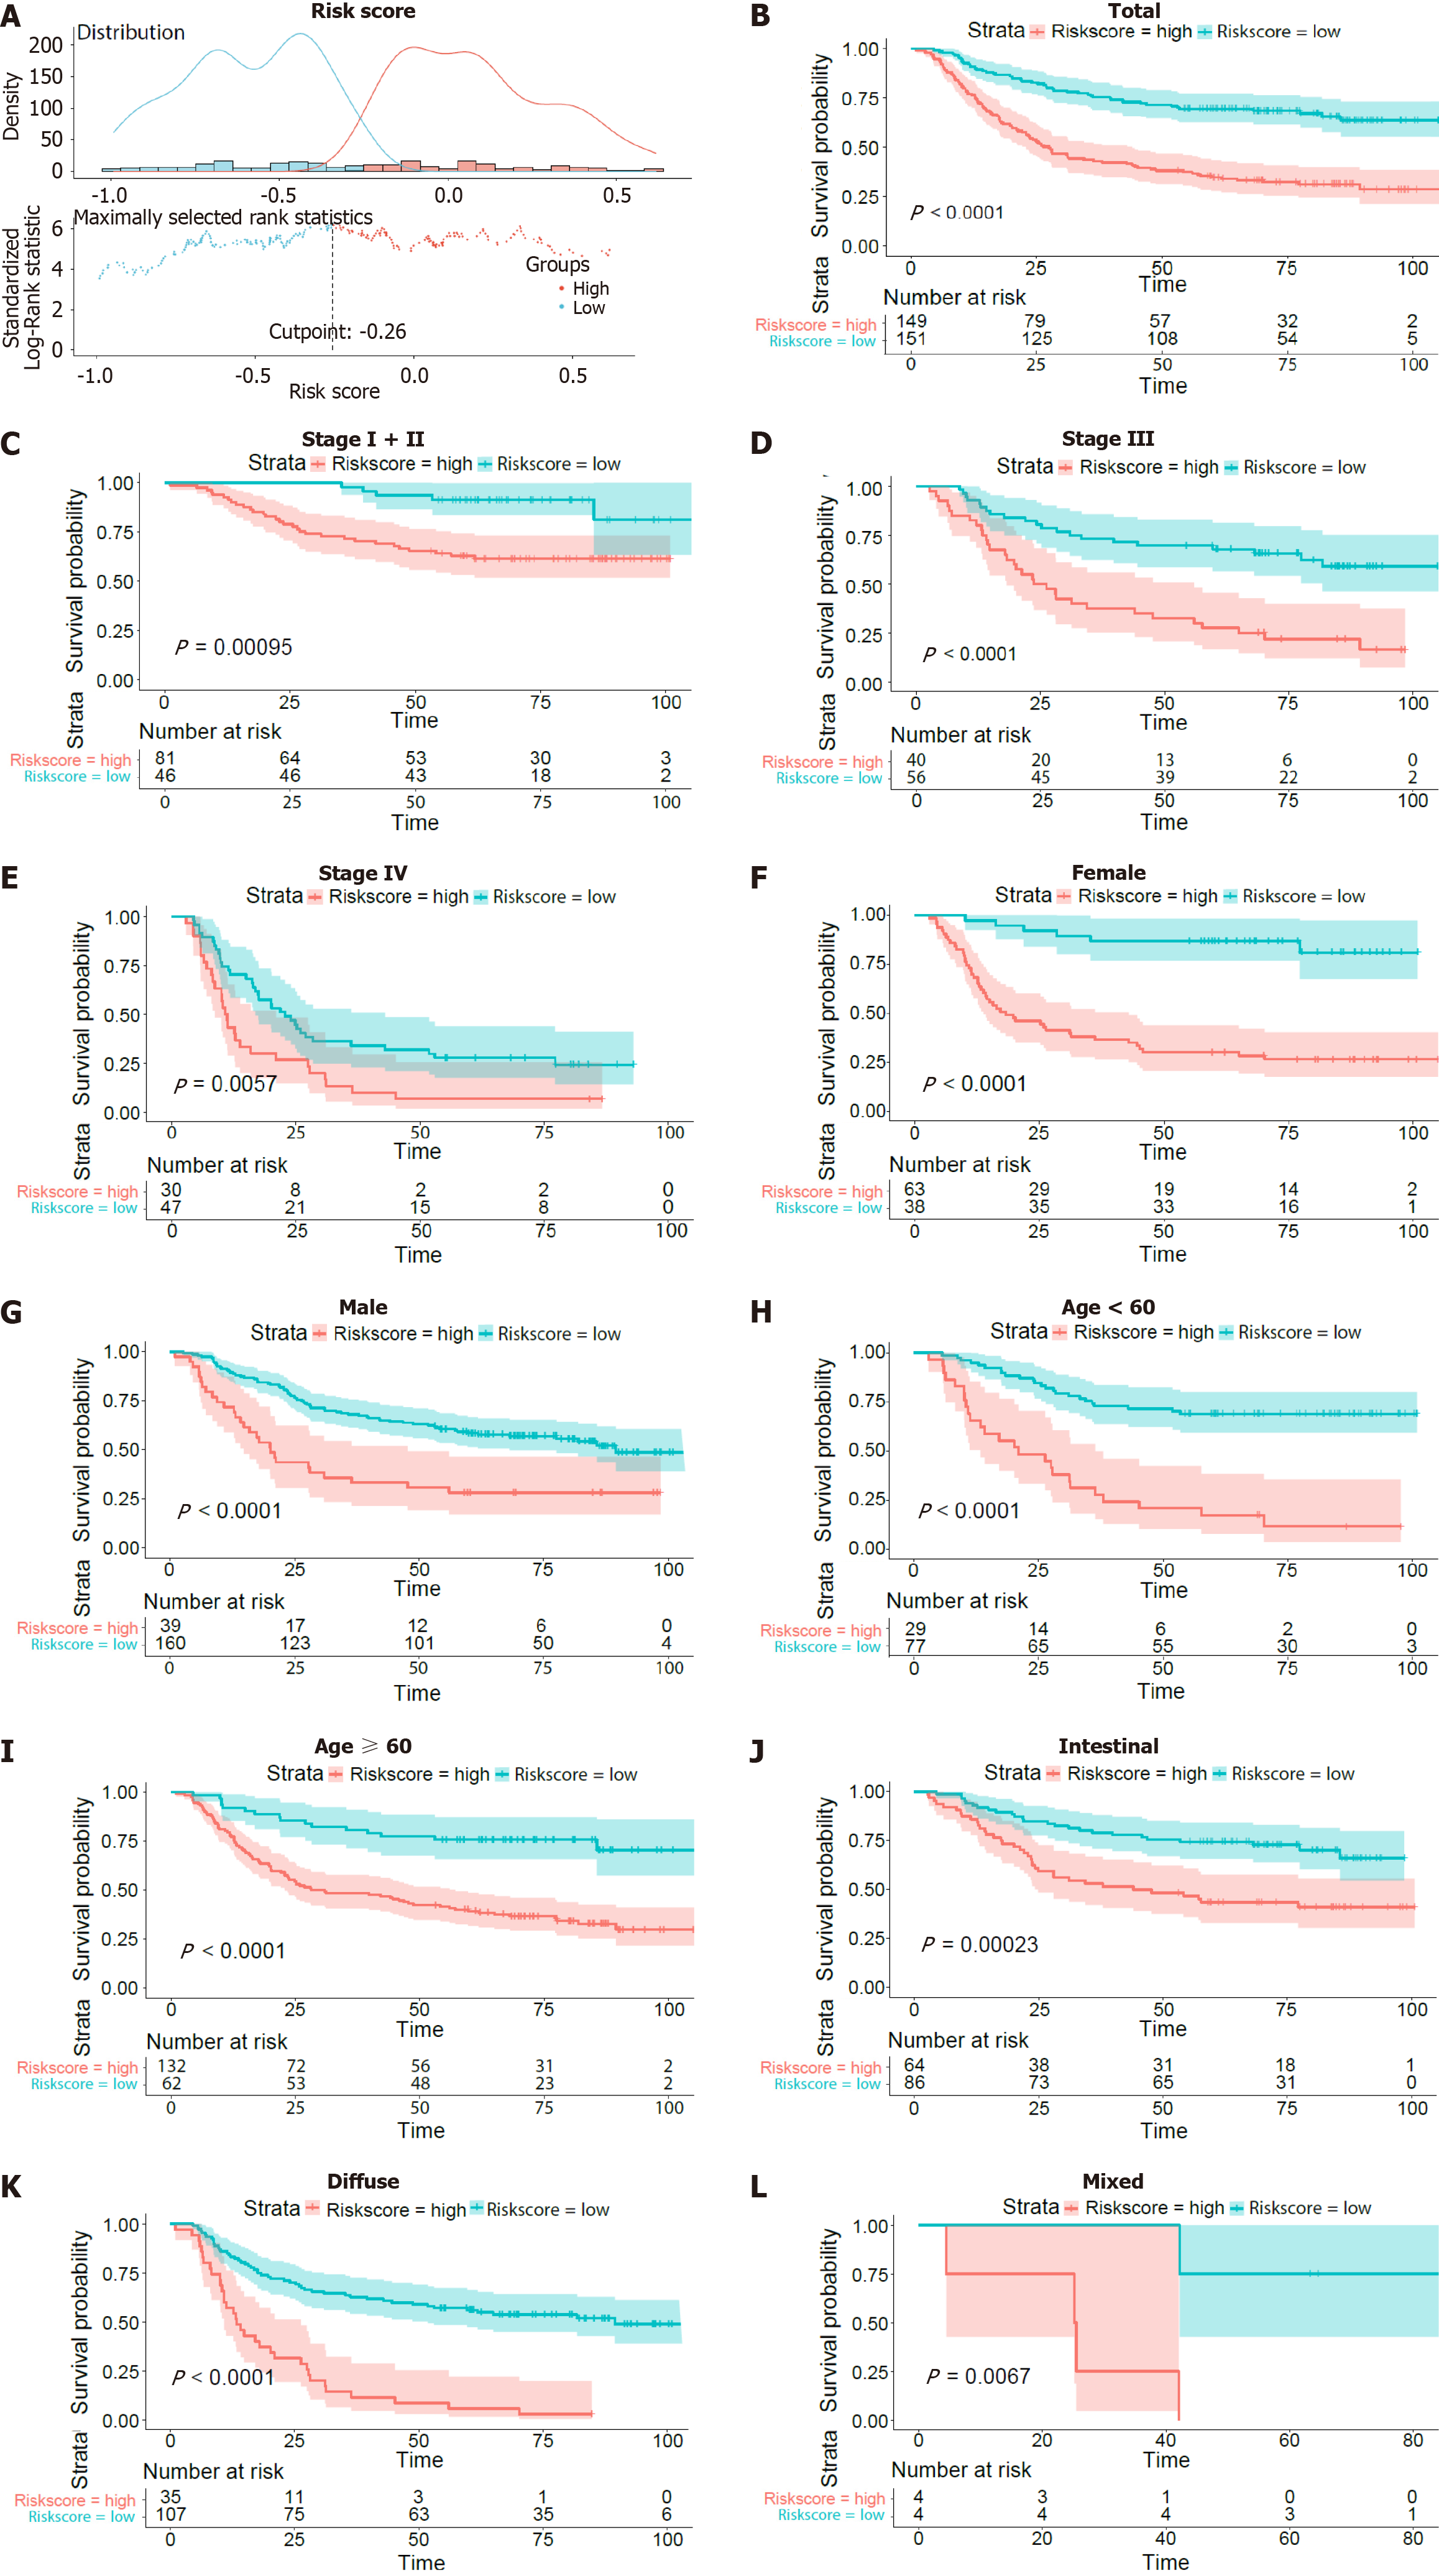
Figure 2 Survival curves of overall survival in the training dataset of GSE66229.
A: The optimal risk score cut-off point in patients with overall survival (OS) status and time records; B: K-M curves of OS between the low-risk and high-risk groups based on the total OS; C-L: K-M curves of OS stratified by TNM stage (stage I + II, stage III or stage IV), sex (female or male), age (> 60 years or ≤ 60 years), and Lauren type (intestinal or diffuse or mixed).
- Citation: Hu JL, Huang MJ, Halina H, Qiao K, Wang ZY, Lu JJ, Yin CL, Gao F. Identification of a novel inflammatory-related gene signature to evaluate the prognosis of gastric cancer patients. World J Gastrointest Oncol 2024; 16(3): 945-967
- URL: https://www.wjgnet.com/1948-5204/full/v16/i3/945.htm
- DOI: https://dx.doi.org/10.4251/wjgo.v16.i3.945


