Copyright
©The Author(s) 2024.
World J Gastrointest Oncol. Mar 15, 2024; 16(3): 819-832
Published online Mar 15, 2024. doi: 10.4251/wjgo.v16.i3.819
Published online Mar 15, 2024. doi: 10.4251/wjgo.v16.i3.819
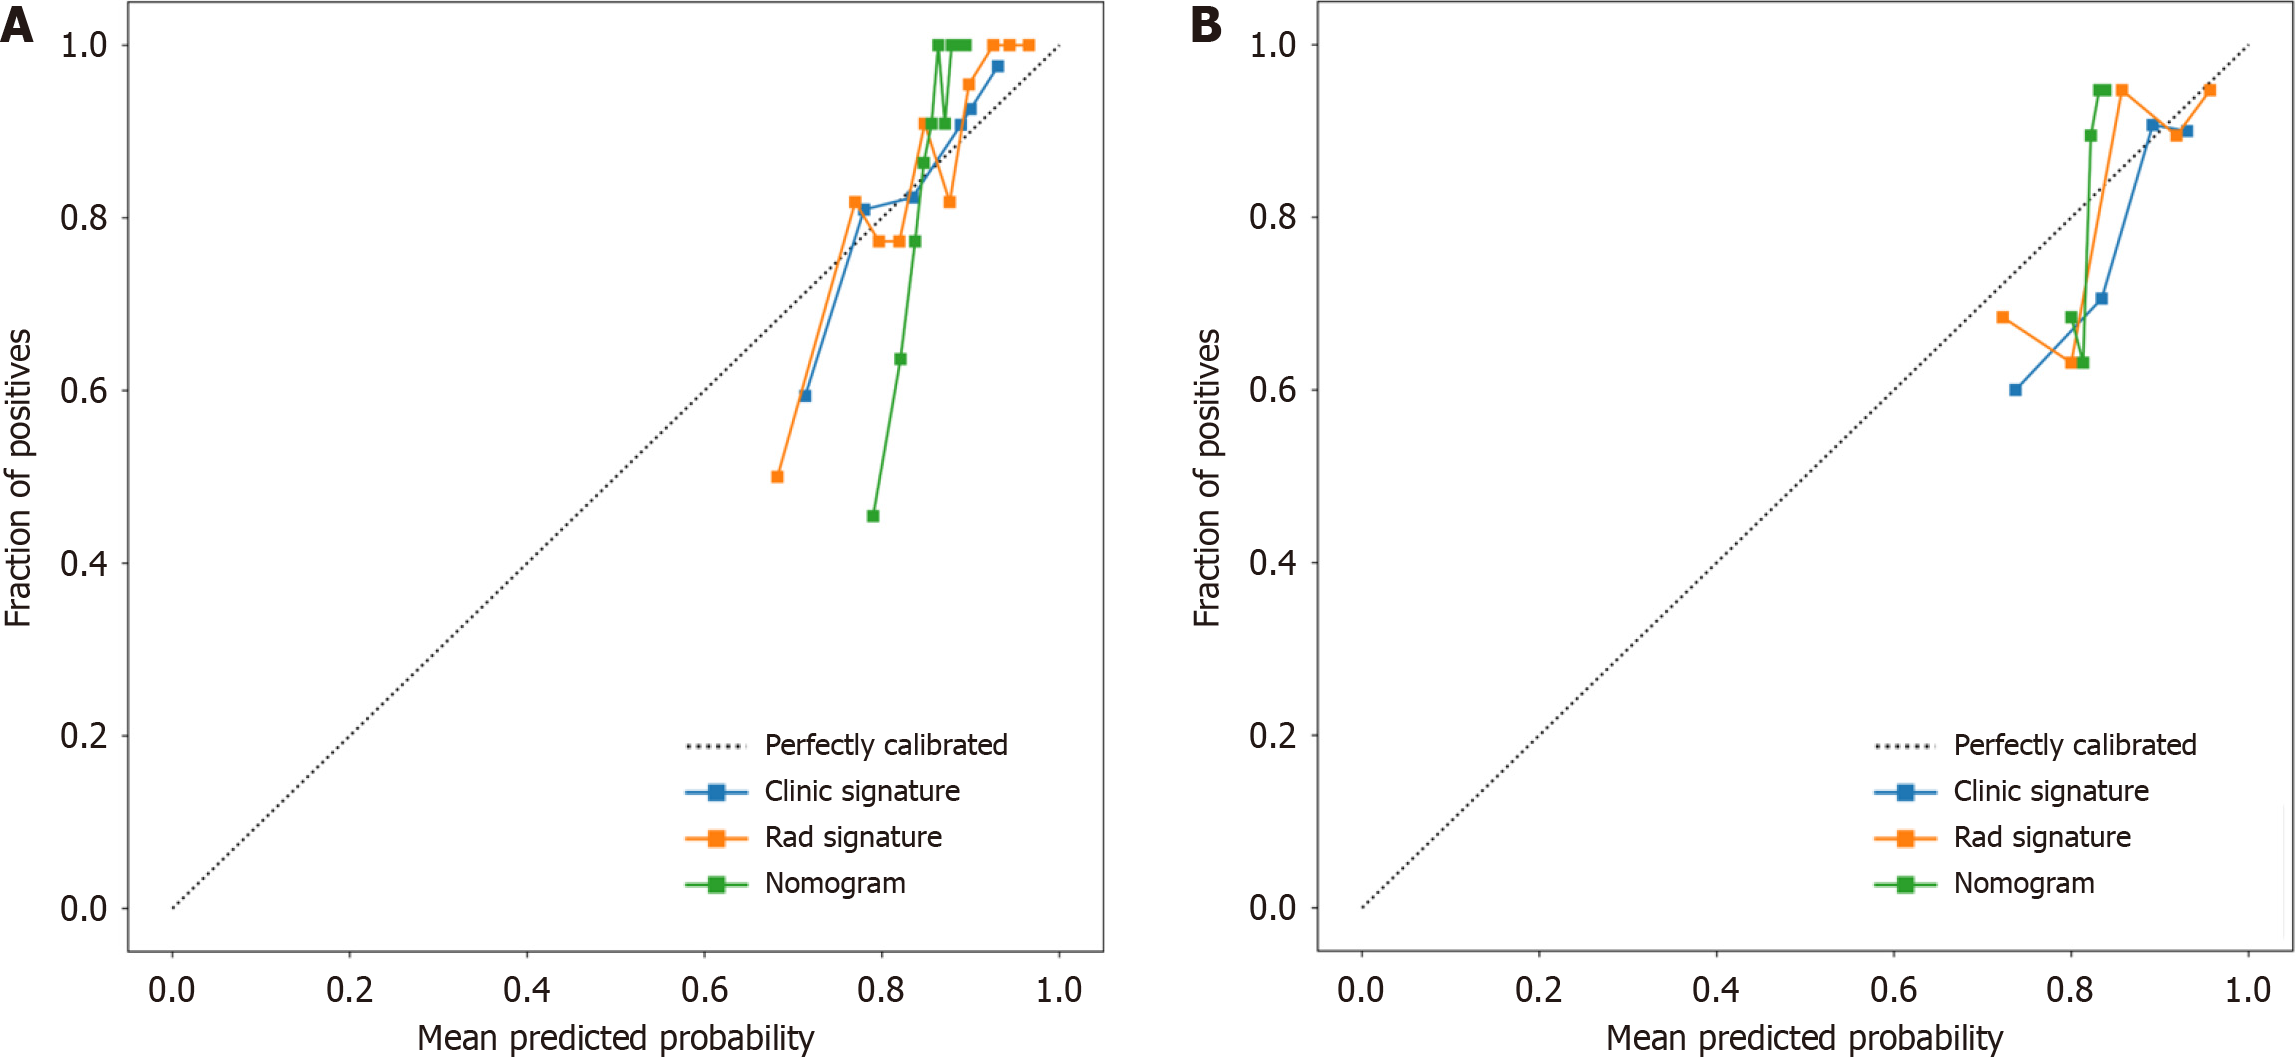
Figure 9 Three models (clinical, radiomic, and combined models) were used to predict the calibration curve of colorectal cancer differentiation in the training cohort and the validation cohort.
A: Calibration curves for the training cohort; B: Calibration curves for the validation cohort. The straight line at 45° represents the standard curve with the probability of perfect matching between the actual (y-axis) and nomogram-predicted (x-axis) differentiation grade. With respect to the training cohort and the validation cohort, the predicted probabilities of the clinical model and the radiomic model closely corresponded to the actual probabilities. Rad: radiomics.
- Citation: Zheng HD, Huang QY, Huang QM, Ke XT, Ye K, Lin S, Xu JH. T2-weighted imaging-based radiomic-clinical machine learning model for predicting the differentiation of colorectal adenocarcinoma. World J Gastrointest Oncol 2024; 16(3): 819-832
- URL: https://www.wjgnet.com/1948-5204/full/v16/i3/819.htm
- DOI: https://dx.doi.org/10.4251/wjgo.v16.i3.819


