Copyright
©The Author(s) 2024.
World J Gastrointest Oncol. Mar 15, 2024; 16(3): 819-832
Published online Mar 15, 2024. doi: 10.4251/wjgo.v16.i3.819
Published online Mar 15, 2024. doi: 10.4251/wjgo.v16.i3.819
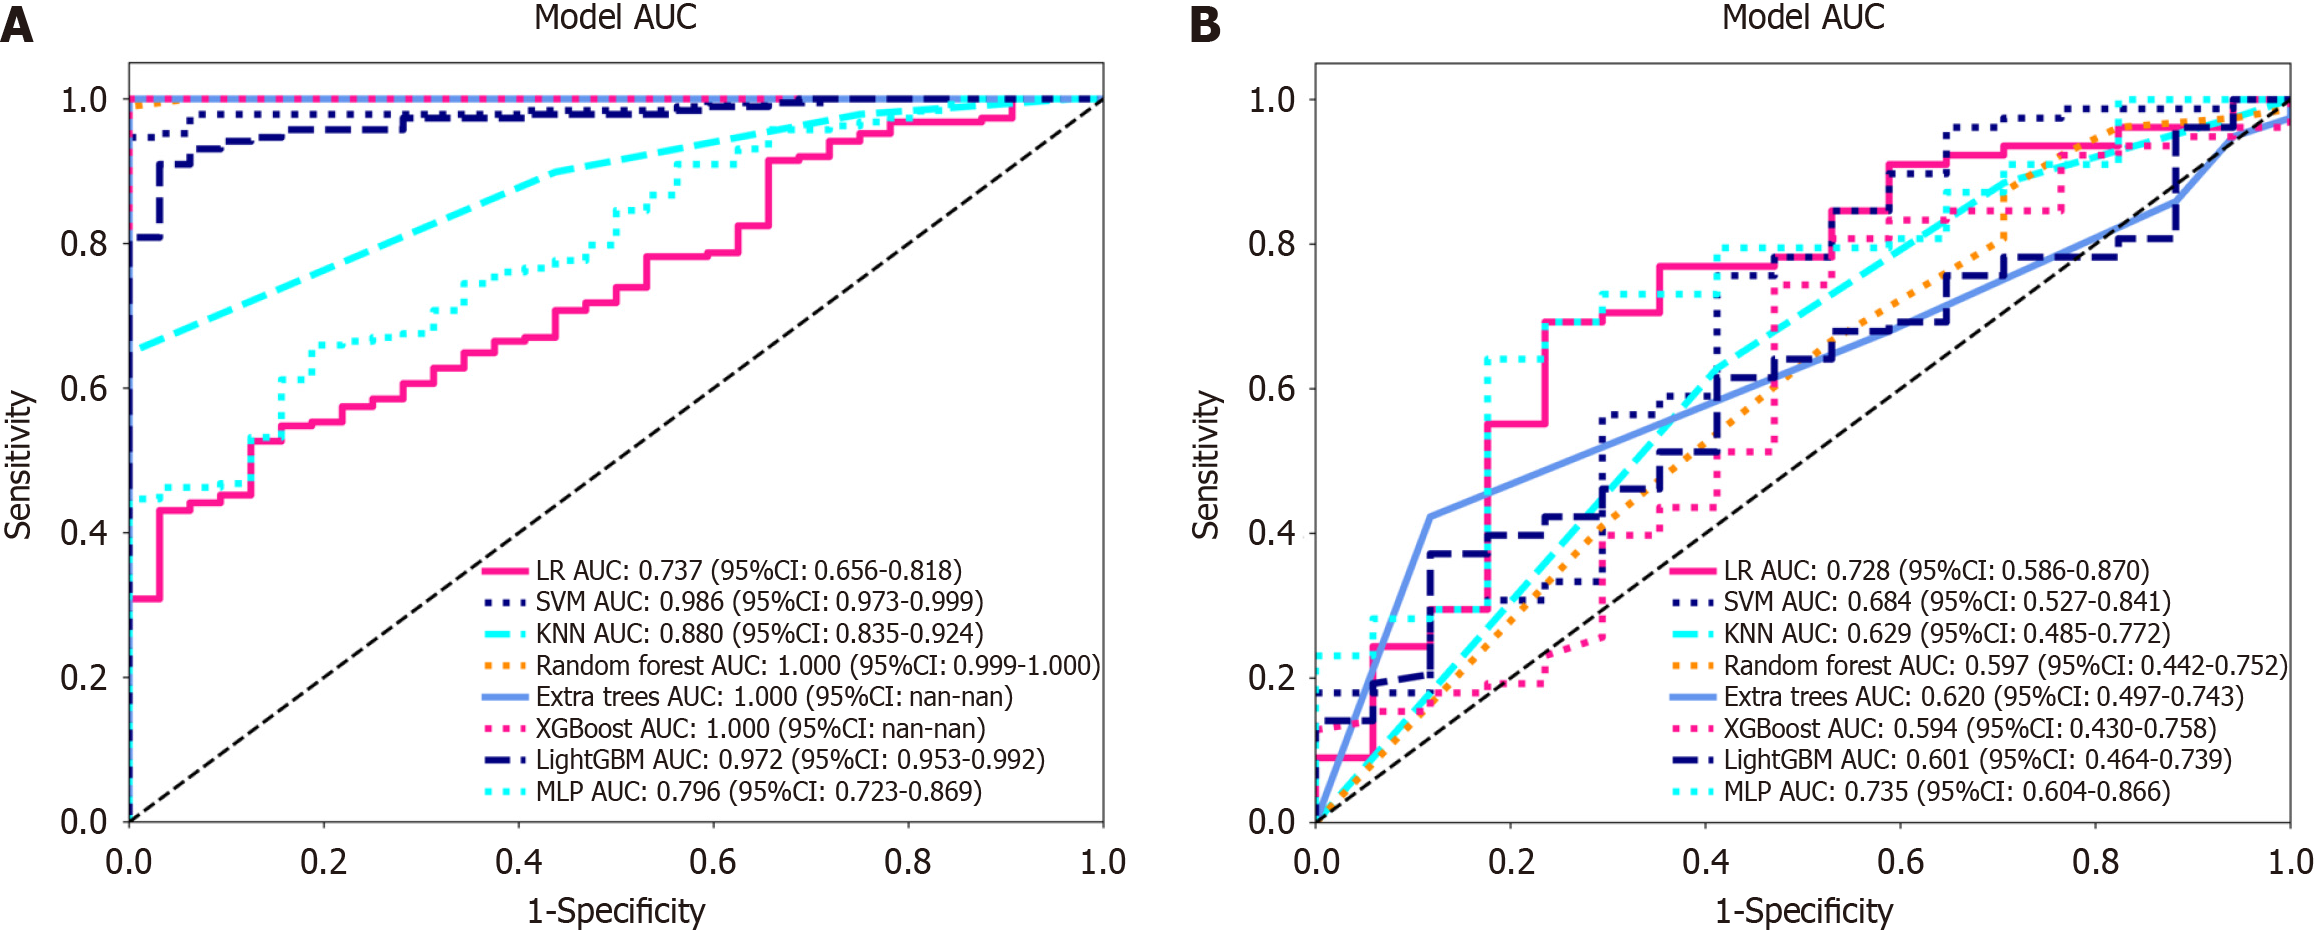
Figure 6 Receiver operating characteristic curves of logistic regression, support vector machine, K-nearest neighbour, random forest, extra trees, extreme gradient boosting, light gradient boosting machine, and multilayer perceptron.
A: In the training cohort; the area under the curve (AUC) values were 0.737, 0.986, 0.880, 1.000, 1.000, 1.000, 0.972, and 0.796, respectively; B: Receiver operating characteristic curves of logistic regression (LR), support vector machine (SVM), K-nearest neighbour (KNN), random forest (RF), extra trees (ET), extreme gradient boosting (XGBoost), light gradient boosting machine (LightGBM), and multilayer perceptron (MLP) in the validation cohort, the AUC values were 0.728, 0.684, 0.629, 0.597, 0.620, 0.594, 0.601 and 0.735, respectively. Except for LR and MLP, the other machine learning algorithms exhibited overfitting, and the AUC of MLP was greater than that of LR. LR: Logistic regression; SVM: Support vector machine; KNN: K-nearest neighbour; RF: Random forest; ET: Extra trees; XGBoost: Extreme gradient boosting; LightGBM: Light gradient boosting machine; MLP: Multilayer perceptron; ROC: Receiver operating characteristic; AUC: Area under the curve.
- Citation: Zheng HD, Huang QY, Huang QM, Ke XT, Ye K, Lin S, Xu JH. T2-weighted imaging-based radiomic-clinical machine learning model for predicting the differentiation of colorectal adenocarcinoma. World J Gastrointest Oncol 2024; 16(3): 819-832
- URL: https://www.wjgnet.com/1948-5204/full/v16/i3/819.htm
- DOI: https://dx.doi.org/10.4251/wjgo.v16.i3.819


