Copyright
©The Author(s) 2024.
World J Gastrointest Oncol. Mar 15, 2024; 16(3): 819-832
Published online Mar 15, 2024. doi: 10.4251/wjgo.v16.i3.819
Published online Mar 15, 2024. doi: 10.4251/wjgo.v16.i3.819
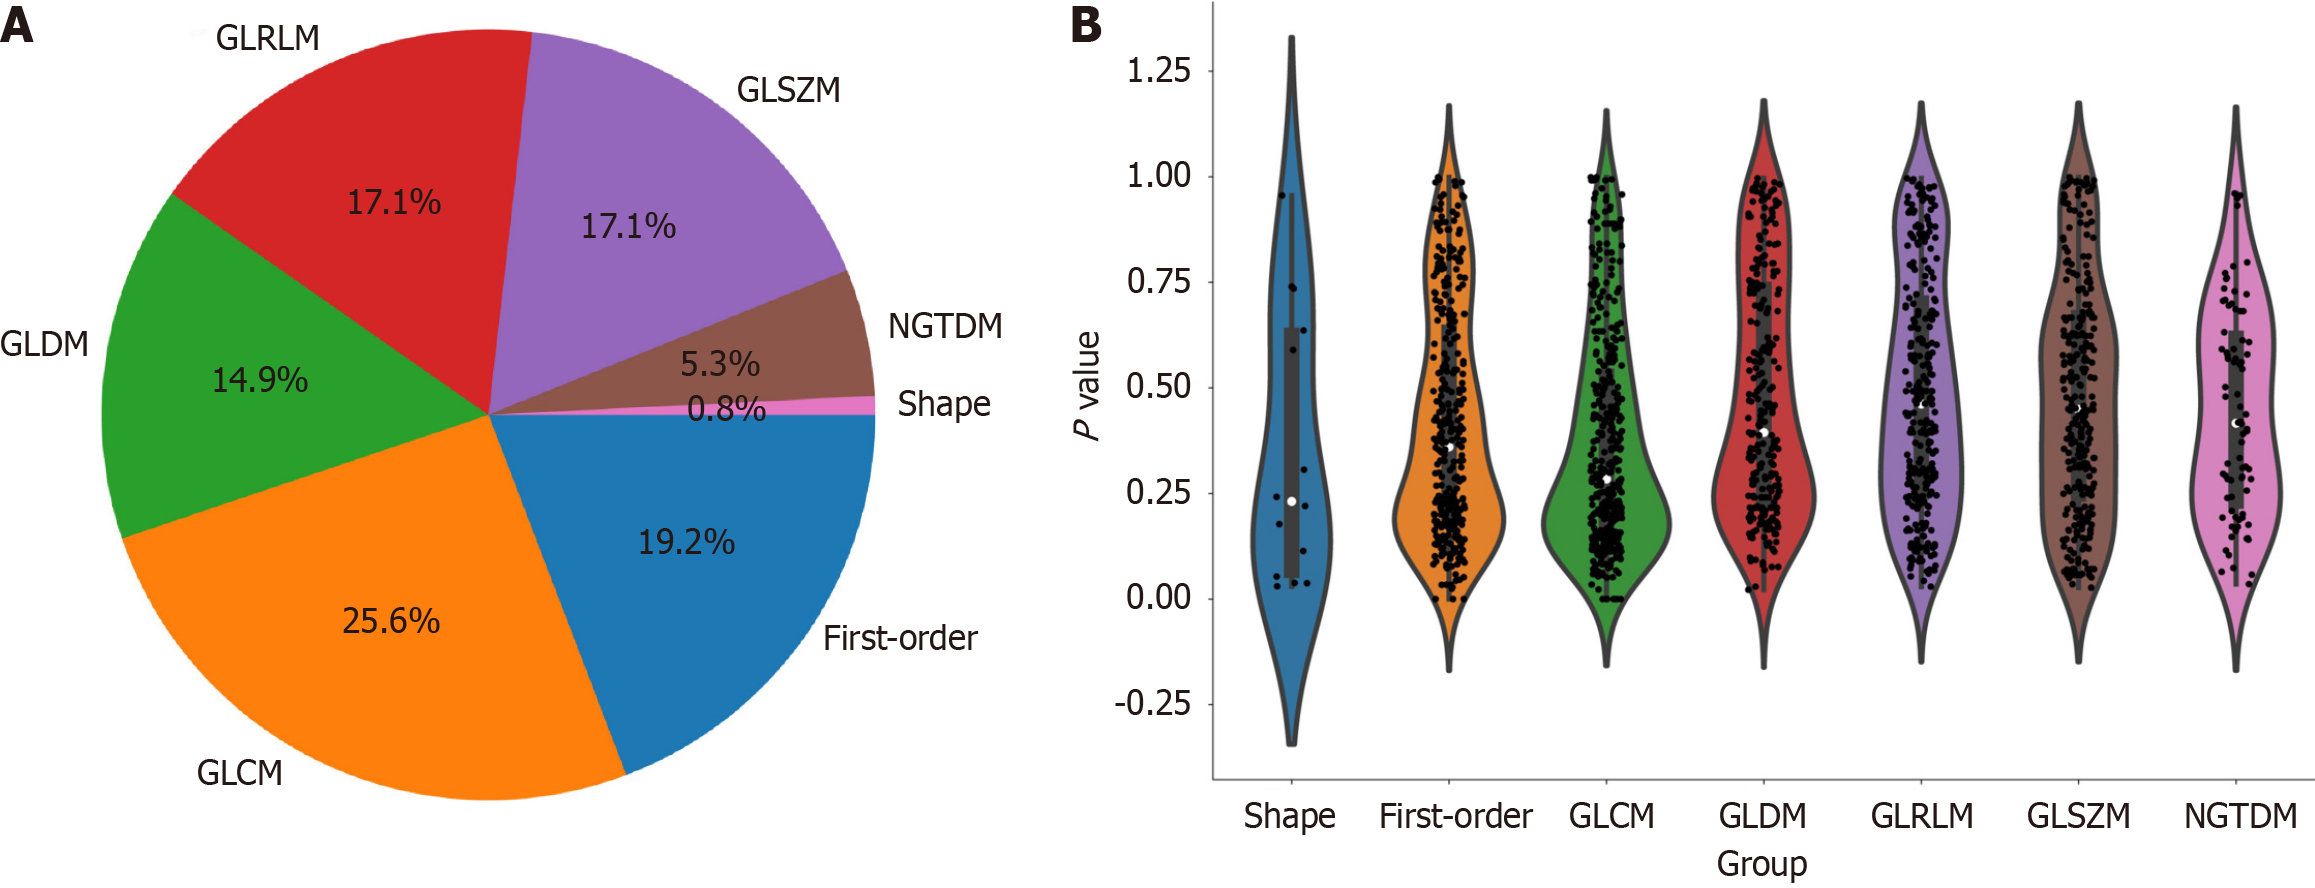
Figure 3 Distribution of radiomic features.
A: The number and proportion of extracted radiomic features; B: Violin plots showing all features and corresponding P values, which help us observe the centralized trend and dispersion of the data. GLCM: Grayscale co-occurrence matrix; GLRLM: Grayscale run length matrix; GLSZM: Grayscale size region matrix, NGTDM: Neighbourhood grayscale difference matrix; GLDM: Grayscale dependency matrix.
- Citation: Zheng HD, Huang QY, Huang QM, Ke XT, Ye K, Lin S, Xu JH. T2-weighted imaging-based radiomic-clinical machine learning model for predicting the differentiation of colorectal adenocarcinoma. World J Gastrointest Oncol 2024; 16(3): 819-832
- URL: https://www.wjgnet.com/1948-5204/full/v16/i3/819.htm
- DOI: https://dx.doi.org/10.4251/wjgo.v16.i3.819


