Copyright
©The Author(s) 2024.
World J Gastrointest Oncol. Mar 15, 2024; 16(3): 773-786
Published online Mar 15, 2024. doi: 10.4251/wjgo.v16.i3.773
Published online Mar 15, 2024. doi: 10.4251/wjgo.v16.i3.773
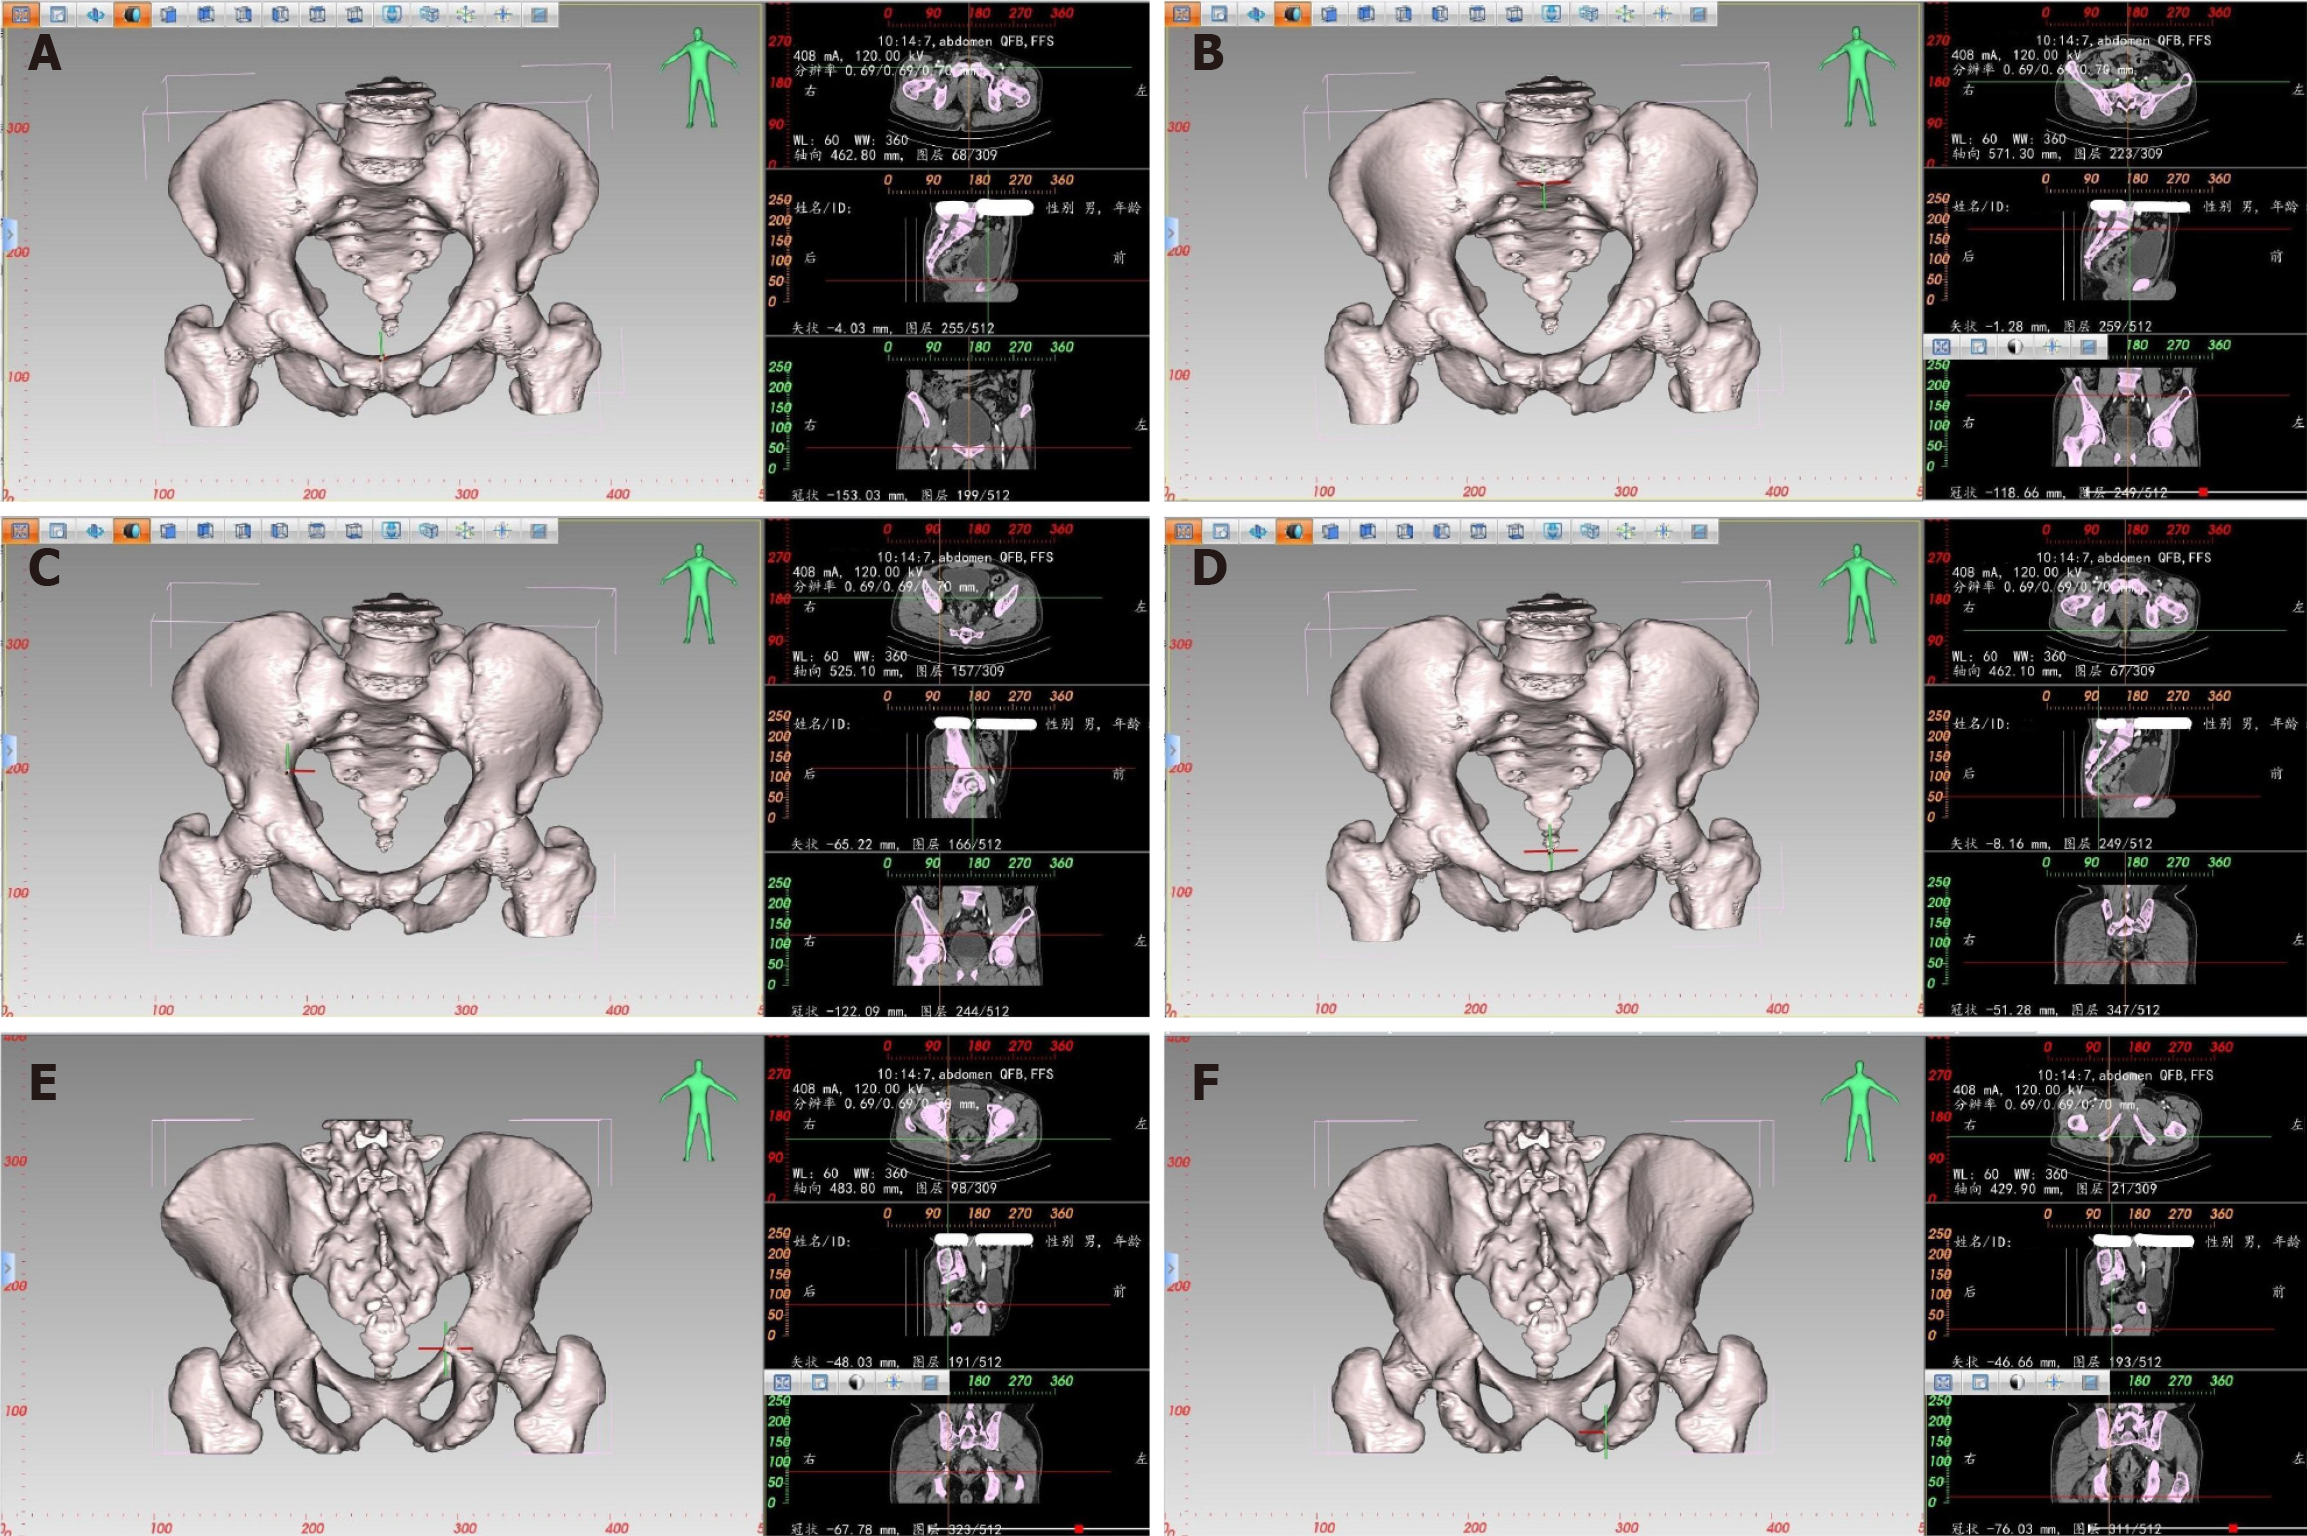
Figure 1 Localization diagram of each positioning point during three-dimensional pelvic measurement.
A: Localization diagram of the highest point of the pubic symphysis during three-dimensional (3D) pelvic measurement (left); positioning of the corresponding measurement point at the intersection of two axis lines on the transverse, sagittal, and coronal planes (right); B: Localization diagram of the midpoint of the anterior edge of the sacral promontory during 3D pelvic measurement (left); positioning of the corresponding measurement point at the intersection of two axis lines on the transverse, sagittal, and coronal planes (right); C: Localization diagram of the maximum distance between the left and right iliopectineal line during 3D pelvic measurement (left); positioning of the corresponding measurement point at the intersection of two axis lines on the transverse, sagittal, and coronal planes (right); D: Localization diagram of the tip of the coccyx during 3D pelvic measurement (left); positioning of the corresponding measurement point at the intersection of two axis lines on the transverse, sagittal, and coronal planes (right); E: Localization diagram of the ischial spine during 3D pelvic measurement (left); positioning of the corresponding measurement point at the intersection of two axis lines on the transverse, sagittal, and coronal planes (right); F: Localization diagram of the ischial tuberosity during 3D pelvic measurement (left); positioning of the corresponding measurement point at the intersection of two axis lines on the transverse, sagittal, and coronal planes (right).
- Citation: Zhou XC, Ke FY, Dhamija G, Chen H, Wang Q. Study on sex differences and potential clinical value of three-dimensional computerized tomography pelvimetry in rectal cancer patients. World J Gastrointest Oncol 2024; 16(3): 773-786
- URL: https://www.wjgnet.com/1948-5204/full/v16/i3/773.htm
- DOI: https://dx.doi.org/10.4251/wjgo.v16.i3.773


