Copyright
©The Author(s) 2024.
World J Gastrointest Oncol. Mar 15, 2024; 16(3): 1046-1058
Published online Mar 15, 2024. doi: 10.4251/wjgo.v16.i3.1046
Published online Mar 15, 2024. doi: 10.4251/wjgo.v16.i3.1046
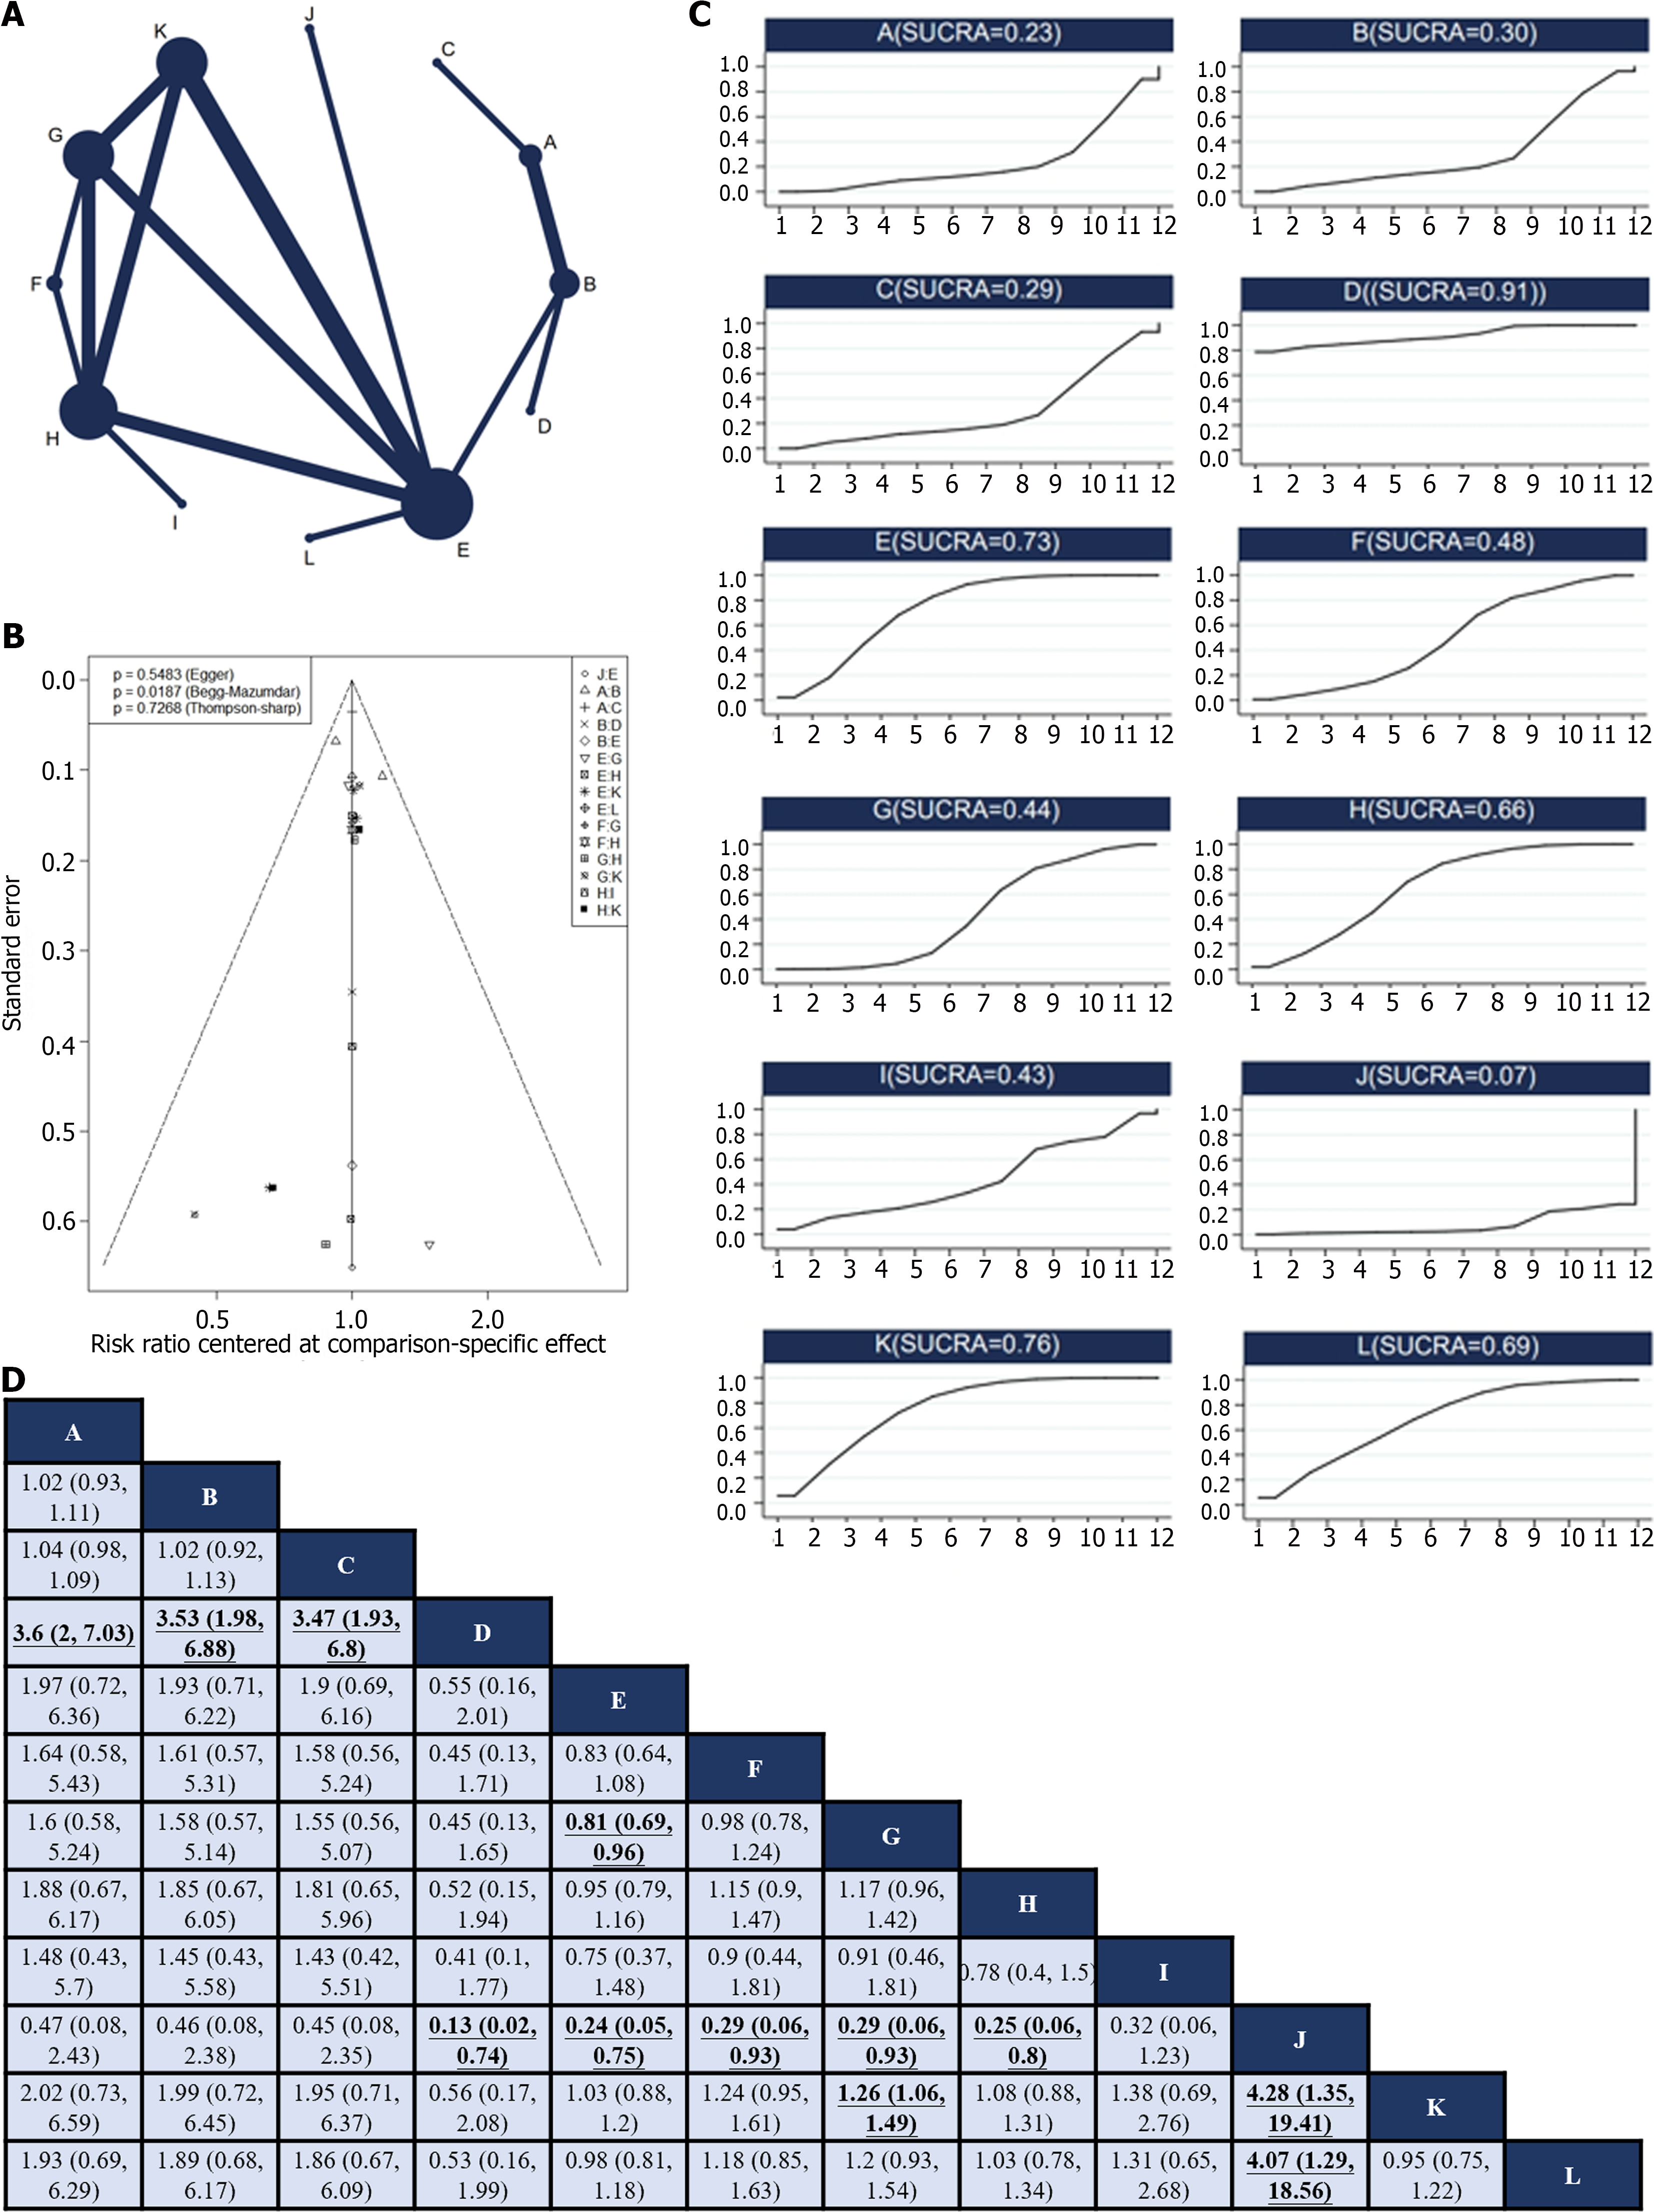
Figure 4 Network meta-analysis of non-surgical severe adverse events.
A: Network diagram of higher nonsurgical severe adverse events (SAEs); B: The published biased funnel plot of non-surgical SAEs; C: Comparisons between each treatment. old and underlined indicate statistically significant pairwise comparisons; D: Surface under the cumulative ranking value of non-surgical SAEs of each intervention. A: Neoadjuvant plus adjuvant ECF, B: Neoadjuvant plus adjuvant FLOT, C: Neoadjuvant ECF plus adjuvant ECF and radiotherapy, D: Neoadjuvant plus adjuvant FLO, E: Neoadjuvant plus adjuvant SOX, F: Neoadjuvant DOX plus adjuvant SOX, G: Neoadjuvant plus adjuvant XELOX, H: Adjuvant XELOX, I: Neoadjuvant and radiotherapy plus adjuvant XELOX, J: Neoadjuvant SOX and radiotherapy plus adjuvant SOX, K: Adjuvant SOX, L: Neoadjuvant plus adjuvant FOLFOX.
- Citation: Kuang ZY, Sun QH, Cao LC, Ma XY, Wang JX, Liu KX, Li J. Efficacy and safety of perioperative therapy for locally resectable gastric cancer: A network meta-analysis of randomized clinical trials. World J Gastrointest Oncol 2024; 16(3): 1046-1058
- URL: https://www.wjgnet.com/1948-5204/full/v16/i3/1046.htm
- DOI: https://dx.doi.org/10.4251/wjgo.v16.i3.1046


