Copyright
©The Author(s) 2024.
World J Gastrointest Oncol. Feb 15, 2024; 16(2): 414-435
Published online Feb 15, 2024. doi: 10.4251/wjgo.v16.i2.414
Published online Feb 15, 2024. doi: 10.4251/wjgo.v16.i2.414
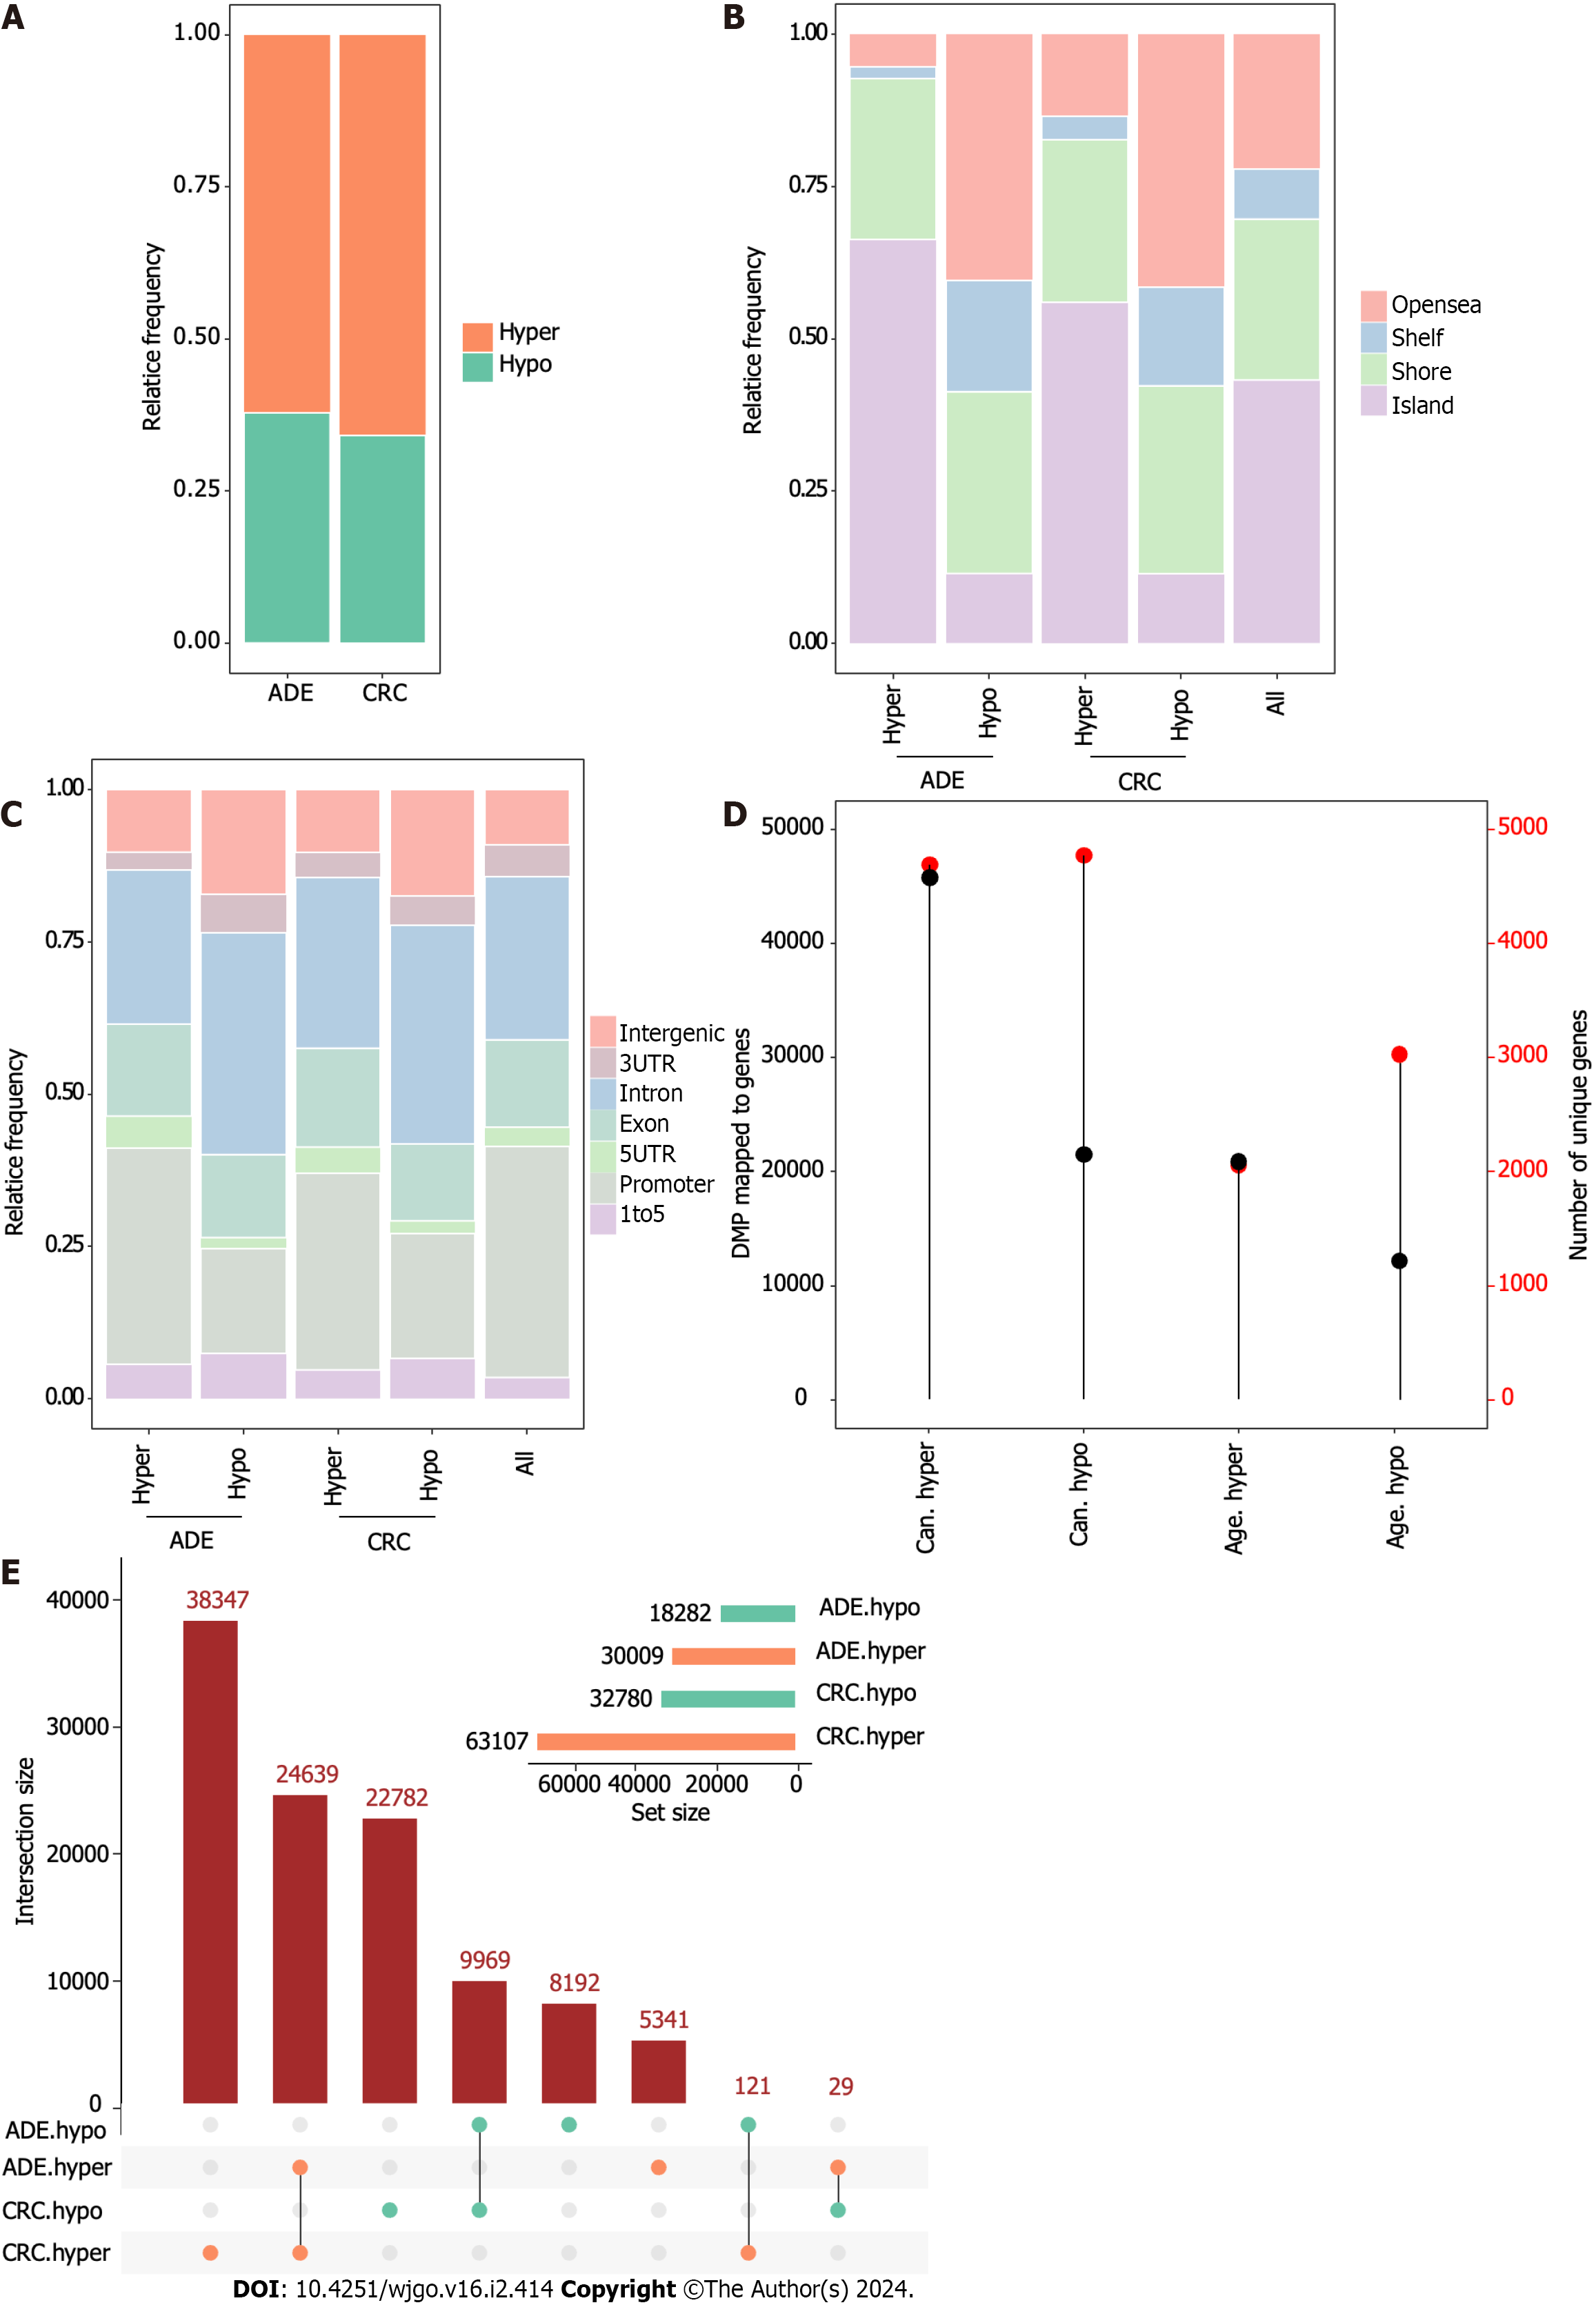
Figure 2 Differentially methylated positions in adenoma and colorectal cancer.
A: Barplot showing the relative frequency of hypermethylated and hypomethylated differentially methylated positions (DMPs) in adenoma (ADE) and colorectal cancer; B and C: Barplots showing the distribution of DMPs on CpG island features and gene-region location features; D: Lollipop plots showing the number of DMPs (left vertical axis, black dots) with the number of genes to which DMPs were uniquely mapped (right vertical axis, red dots); E: UpSet plot indicating the size of DMP sets and the intersections based on their overlaps. ADE: Adenoma; CRC: Colorectal cancer; DMP: Differentially methylated position.
- Citation: Lu YW, Ding ZL, Mao R, Zhao GG, He YQ, Li XL, Liu J. Early results of the integrative epigenomic-transcriptomic landscape of colorectal adenoma and cancer. World J Gastrointest Oncol 2024; 16(2): 414-435
- URL: https://www.wjgnet.com/1948-5204/full/v16/i2/414.htm
- DOI: https://dx.doi.org/10.4251/wjgo.v16.i2.414


