Copyright
©The Author(s) 2024.
World J Gastrointest Oncol. Feb 15, 2024; 16(2): 314-330
Published online Feb 15, 2024. doi: 10.4251/wjgo.v16.i2.314
Published online Feb 15, 2024. doi: 10.4251/wjgo.v16.i2.314
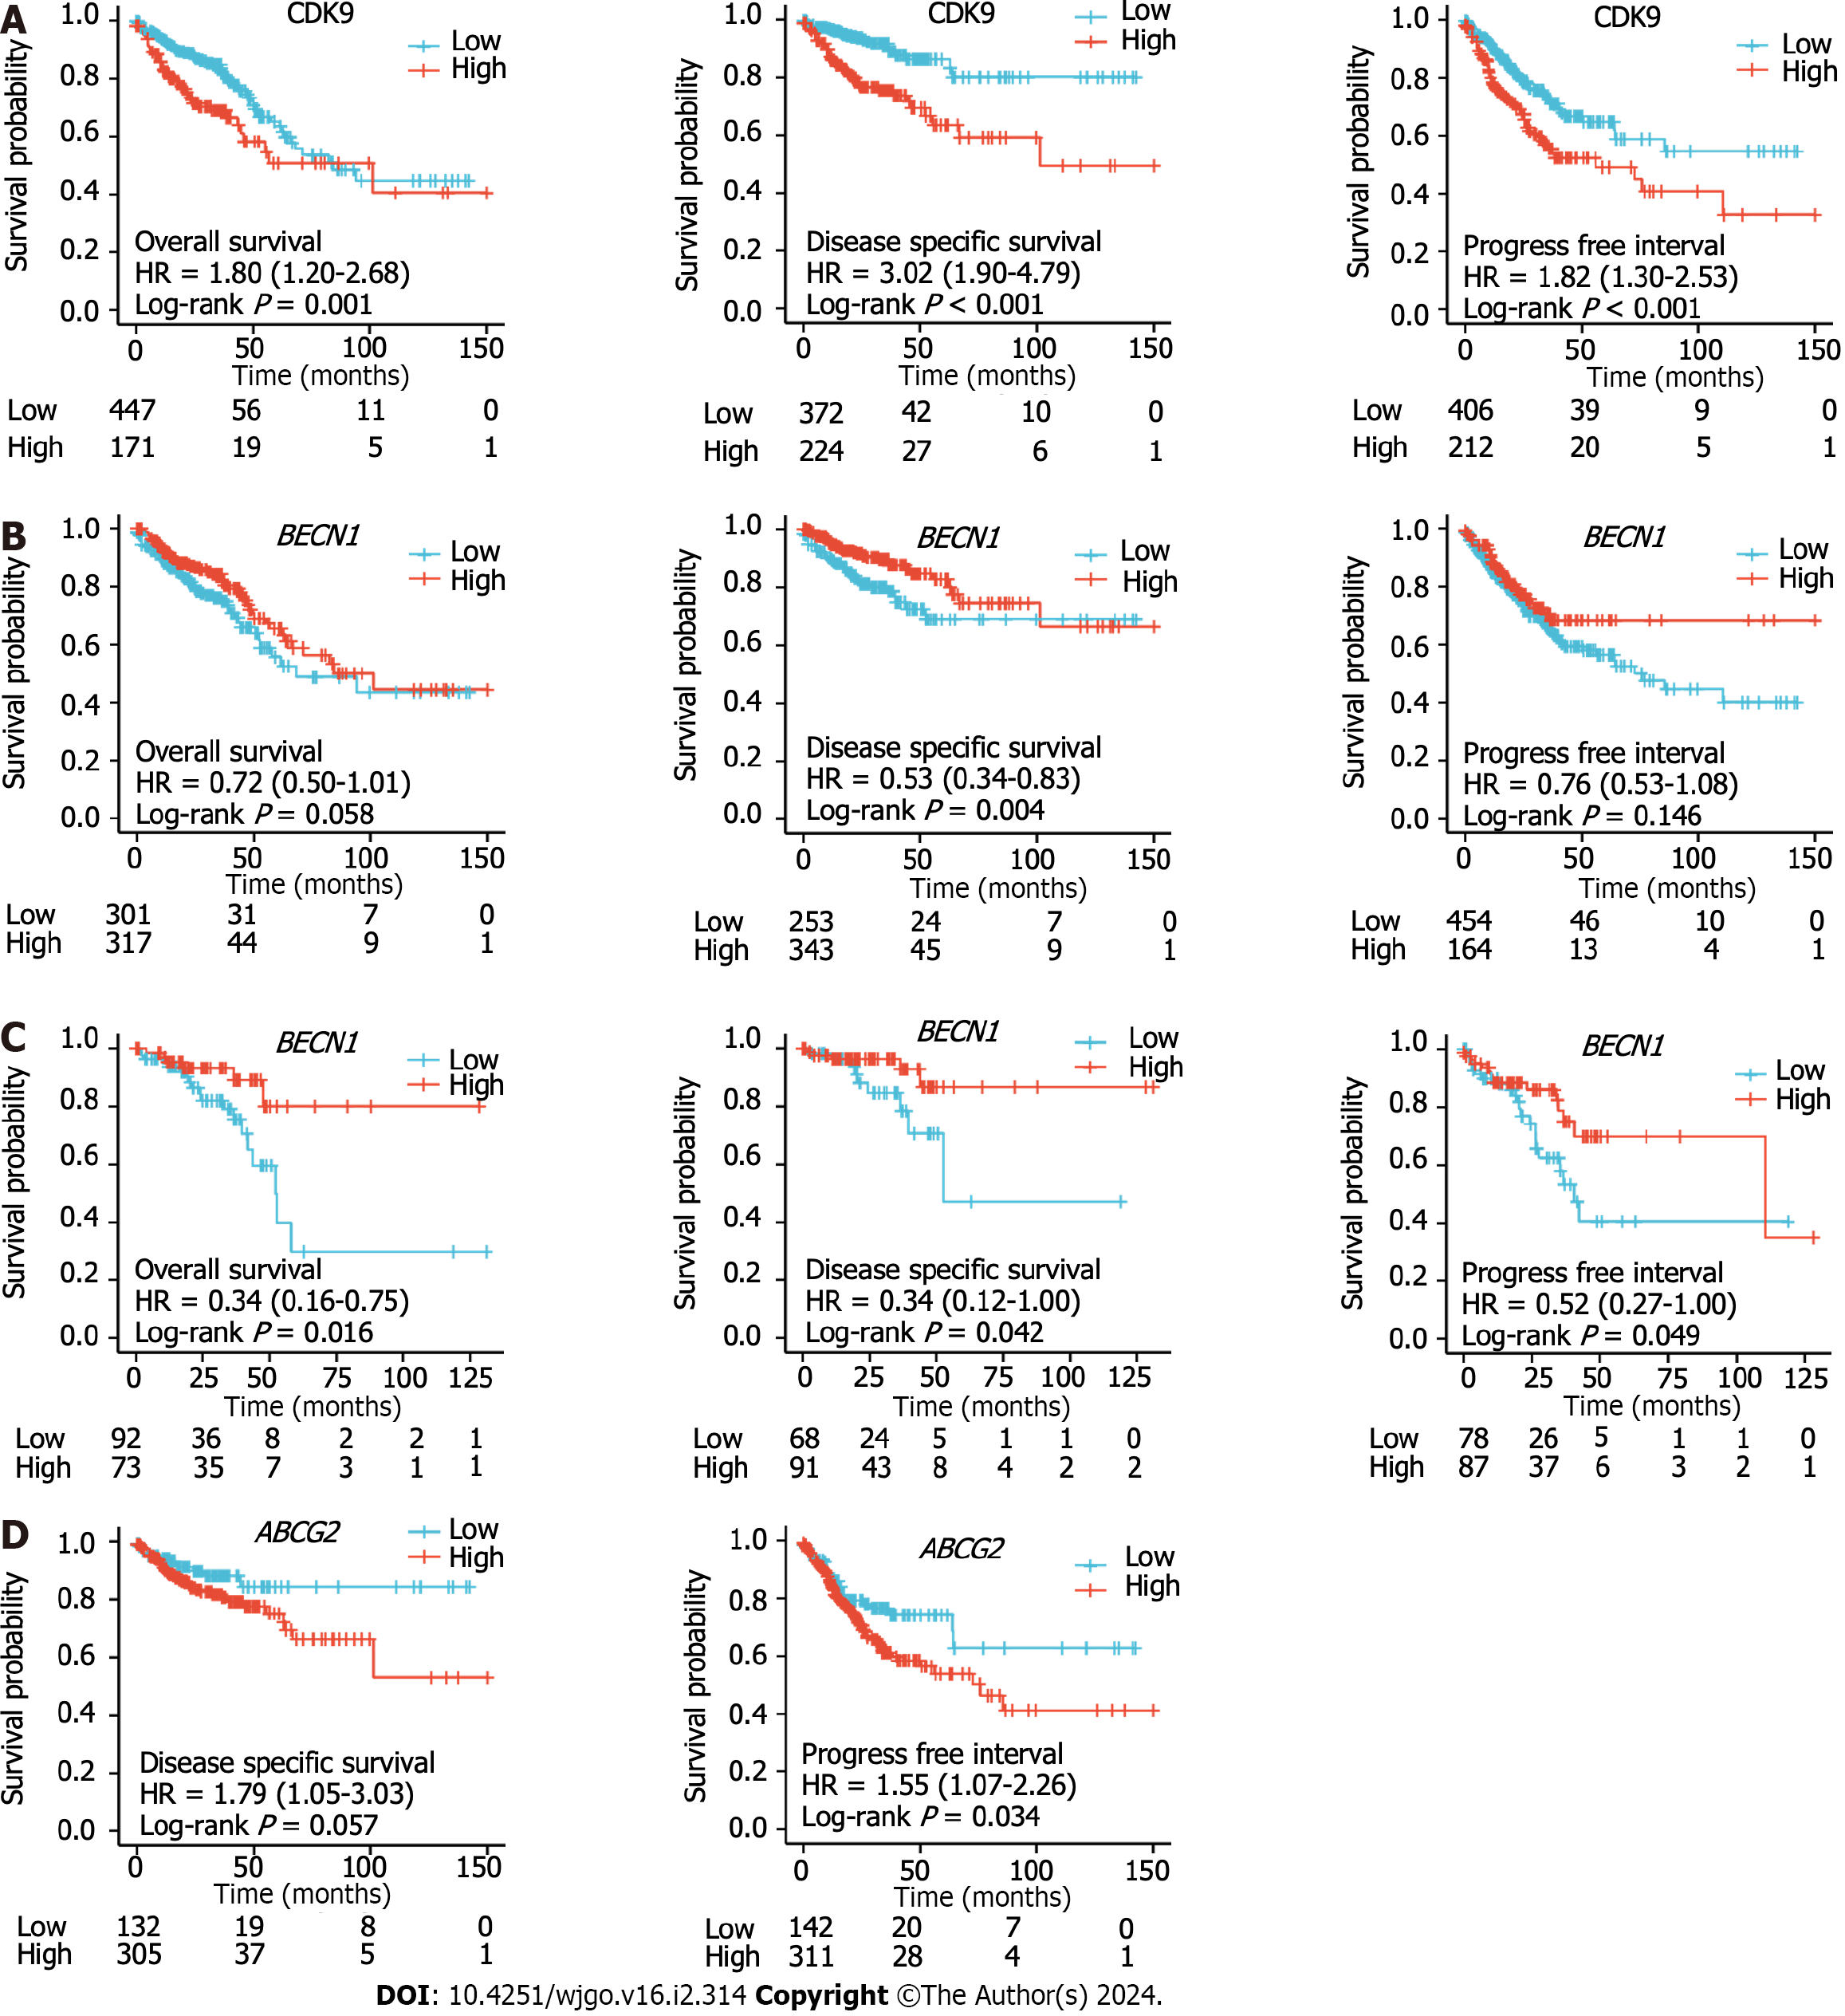
Figure 3 Kaplan–Meier curves of colorectal cancer patients.
A: Kaplan-Meier curves of overall survival (OS), disease-specific survival (DSS), and progression-free interval (PFI) in colorectal cancer patients with high and low expression levels of cyclin-dependent kinase 9 (CDK9); B: Kaplan-Meier curves of OS, DSS, and PFI of colon cancer patients with high and low expression levels of BECN1; C: Kaplan-Meier curves of OS, DSS, and PFI of rectum cancer patients with high and low expression levels of BECN1; D: Kaplan-Meier curves of DSS and PFI of colon cancer patients with high and low expression levels of ABCG2. HR: Hazard ratio.
- Citation: Zheng L, Lu J, Kong DL. Expression of cyclin-dependent kinase 9 is positively correlated with the autophagy level in colon cancer. World J Gastrointest Oncol 2024; 16(2): 314-330
- URL: https://www.wjgnet.com/1948-5204/full/v16/i2/314.htm
- DOI: https://dx.doi.org/10.4251/wjgo.v16.i2.314


