Copyright
©The Author(s) 2024.
World J Gastrointest Oncol. Nov 15, 2024; 16(11): 4489-4505
Published online Nov 15, 2024. doi: 10.4251/wjgo.v16.i11.4489
Published online Nov 15, 2024. doi: 10.4251/wjgo.v16.i11.4489
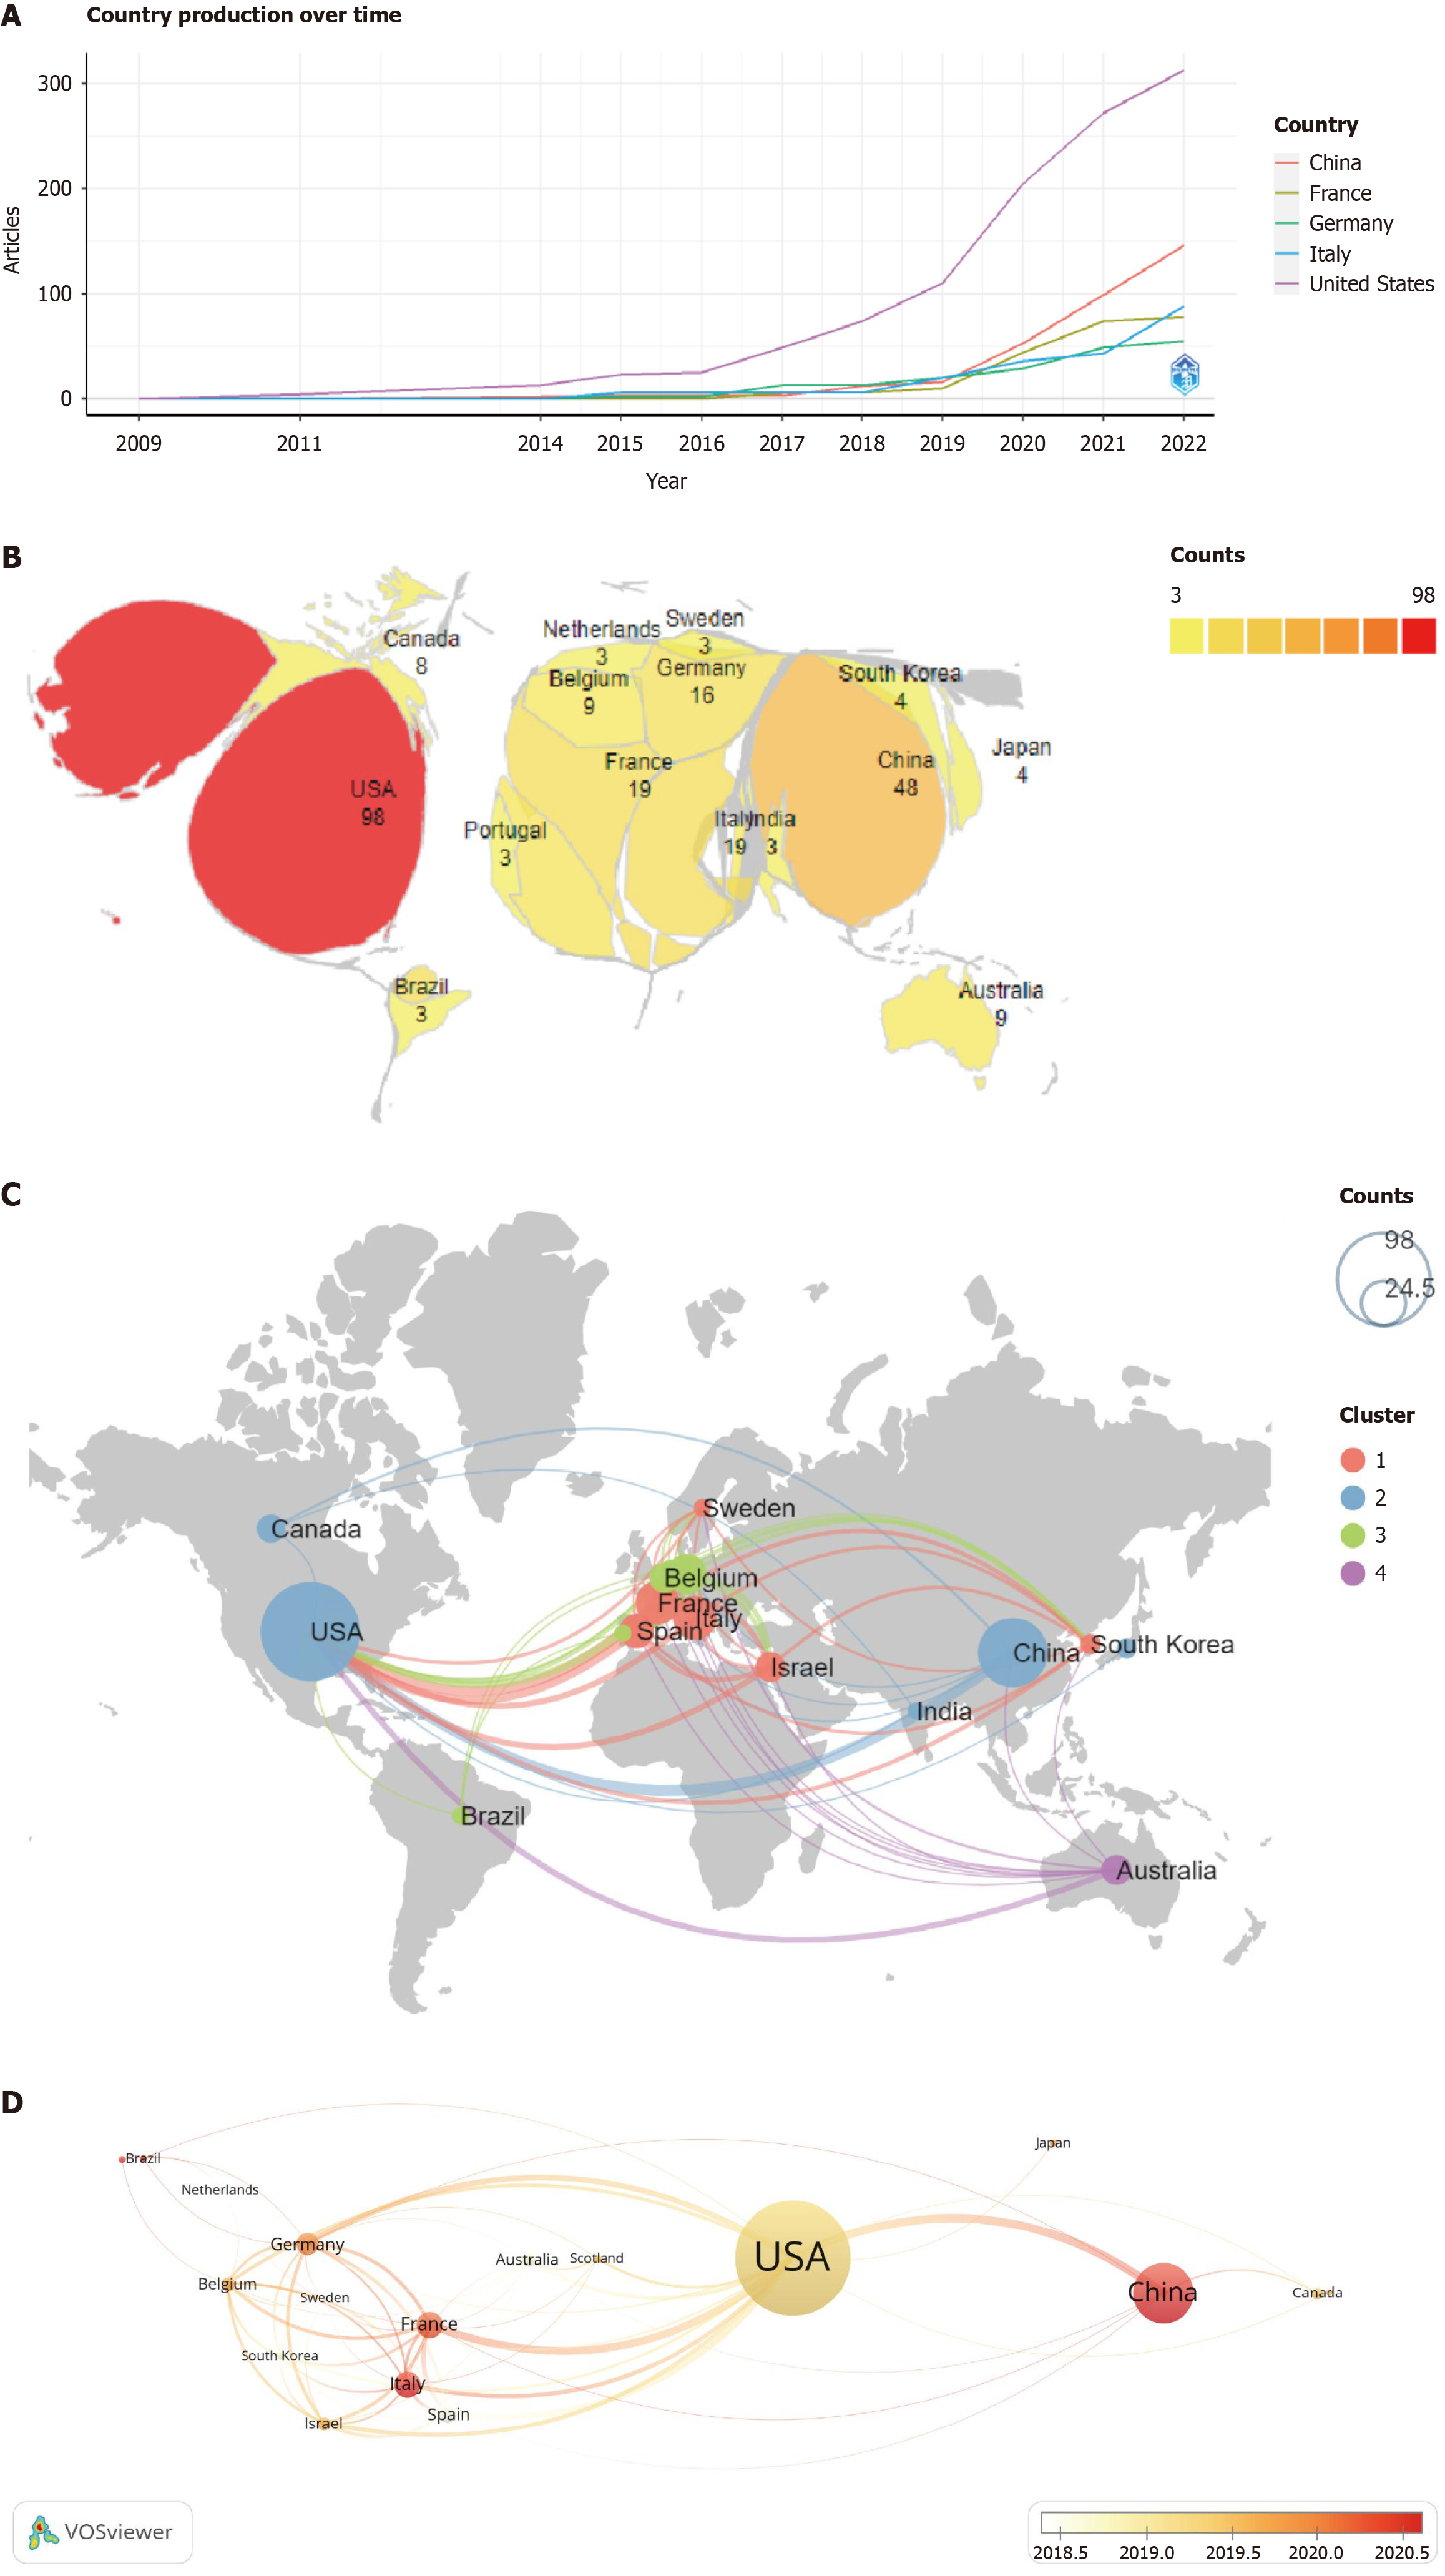
Figure 3 Analysis of countries/regions.
A: Countries’ production throughout the year; B: Deformed geographical distribution map of global productivity related to olaparib in pancreatic cancer. The area and color represent the number of publications; C: Geographical distribution map and collaboration map of publications related to olaparib in pancreatic cancer. Node size and color represent the number of publications; D: Global collaboration and time evolution of countries/regions in this field. The colors of the nodes represent the average number of publications annually.
- Citation: Feng X, Chai YH, Jiang KX, Jiang WB, Chen WC, Pan Y. Bibliometric analysis of olaparib and pancreatic cancer from 2009 to 2022: A global perspective. World J Gastrointest Oncol 2024; 16(11): 4489-4505
- URL: https://www.wjgnet.com/1948-5204/full/v16/i11/4489.htm
- DOI: https://dx.doi.org/10.4251/wjgo.v16.i11.4489


