Copyright
©The Author(s) 2024.
World J Gastrointest Oncol. Nov 15, 2024; 16(11): 4436-4455
Published online Nov 15, 2024. doi: 10.4251/wjgo.v16.i11.4436
Published online Nov 15, 2024. doi: 10.4251/wjgo.v16.i11.4436
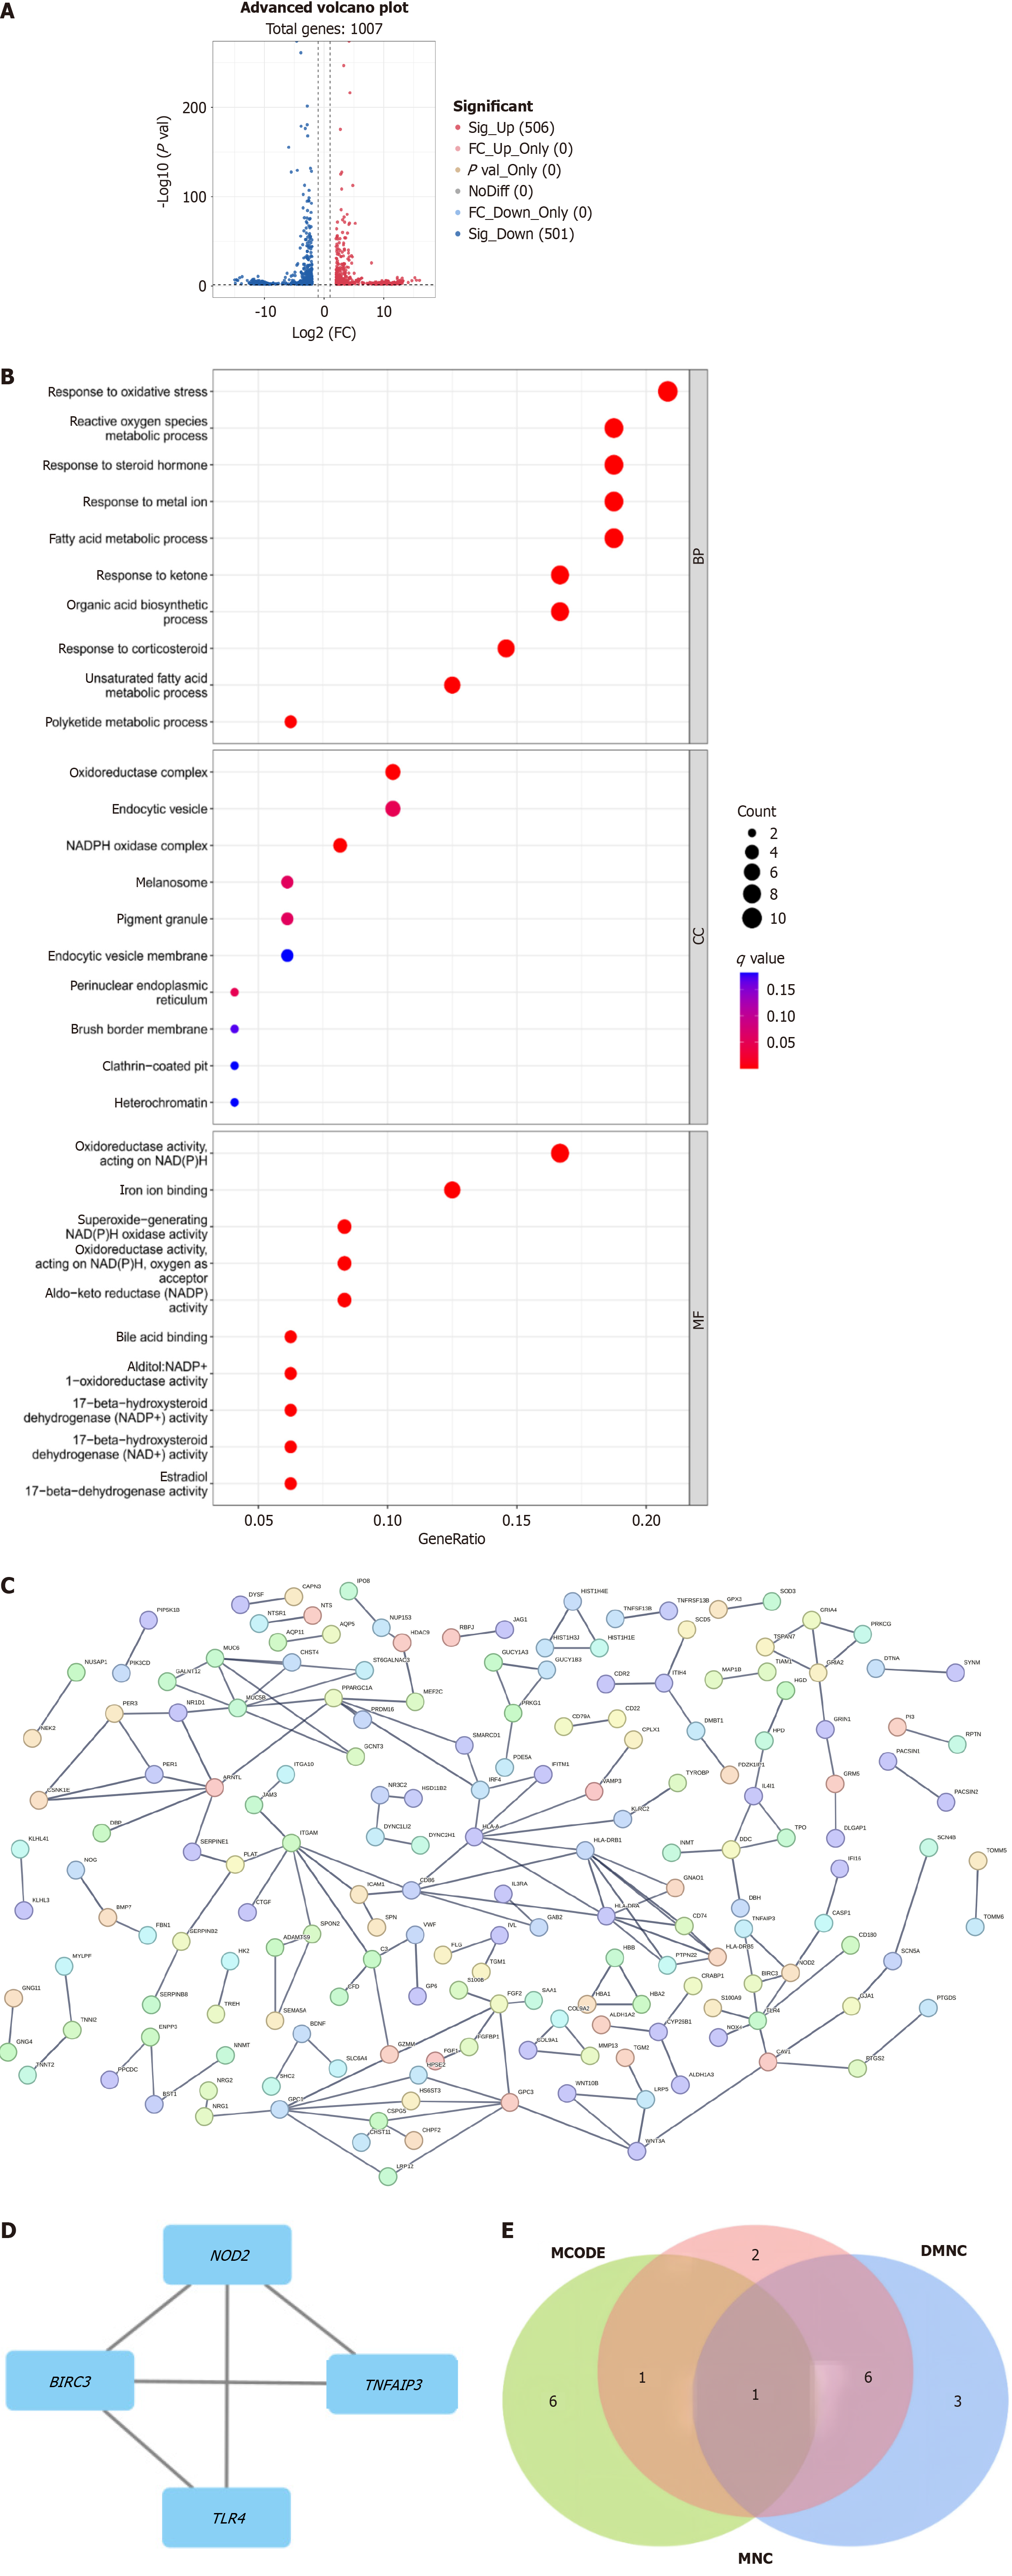
Figure 2 High throughput sequencing and bioinformatics analysis screening Hub genes.
A: The volcano plot was generated from mRNA sequencing analysis of NCI-N87 and NCI-N87R; B: Gene pathway analysis was performed; C: Protein interaction network analysis for BIRC3 was performed using the STRING online tools; D: the top differentially expressed genes were identified by the maximum neighborhood component centrality and neighborhood component centrality algorithms; E: Venn diagram was presented to show the top 10 genes selected using different algorithms, based on the CytoHubba online tools. FC: Fold change; DMNC: Density of maximum neighborhood component; MNC: Maximum neighborhood component.
- Citation: Li SL, Wang PY, Jia YP, Zhang ZX, He HY, Chen PY, Liu X, Liu B, Lu L, Fu WH. BIRC3 induces the phosphoinositide 3-kinase-Akt pathway activation to promote trastuzumab resistance in human epidermal growth factor receptor 2-positive gastric cancer. World J Gastrointest Oncol 2024; 16(11): 4436-4455
- URL: https://www.wjgnet.com/1948-5204/full/v16/i11/4436.htm
- DOI: https://dx.doi.org/10.4251/wjgo.v16.i11.4436


