Copyright
©The Author(s) 2024.
World J Gastrointest Oncol. Oct 15, 2024; 16(10): 4244-4263
Published online Oct 15, 2024. doi: 10.4251/wjgo.v16.i10.4244
Published online Oct 15, 2024. doi: 10.4251/wjgo.v16.i10.4244
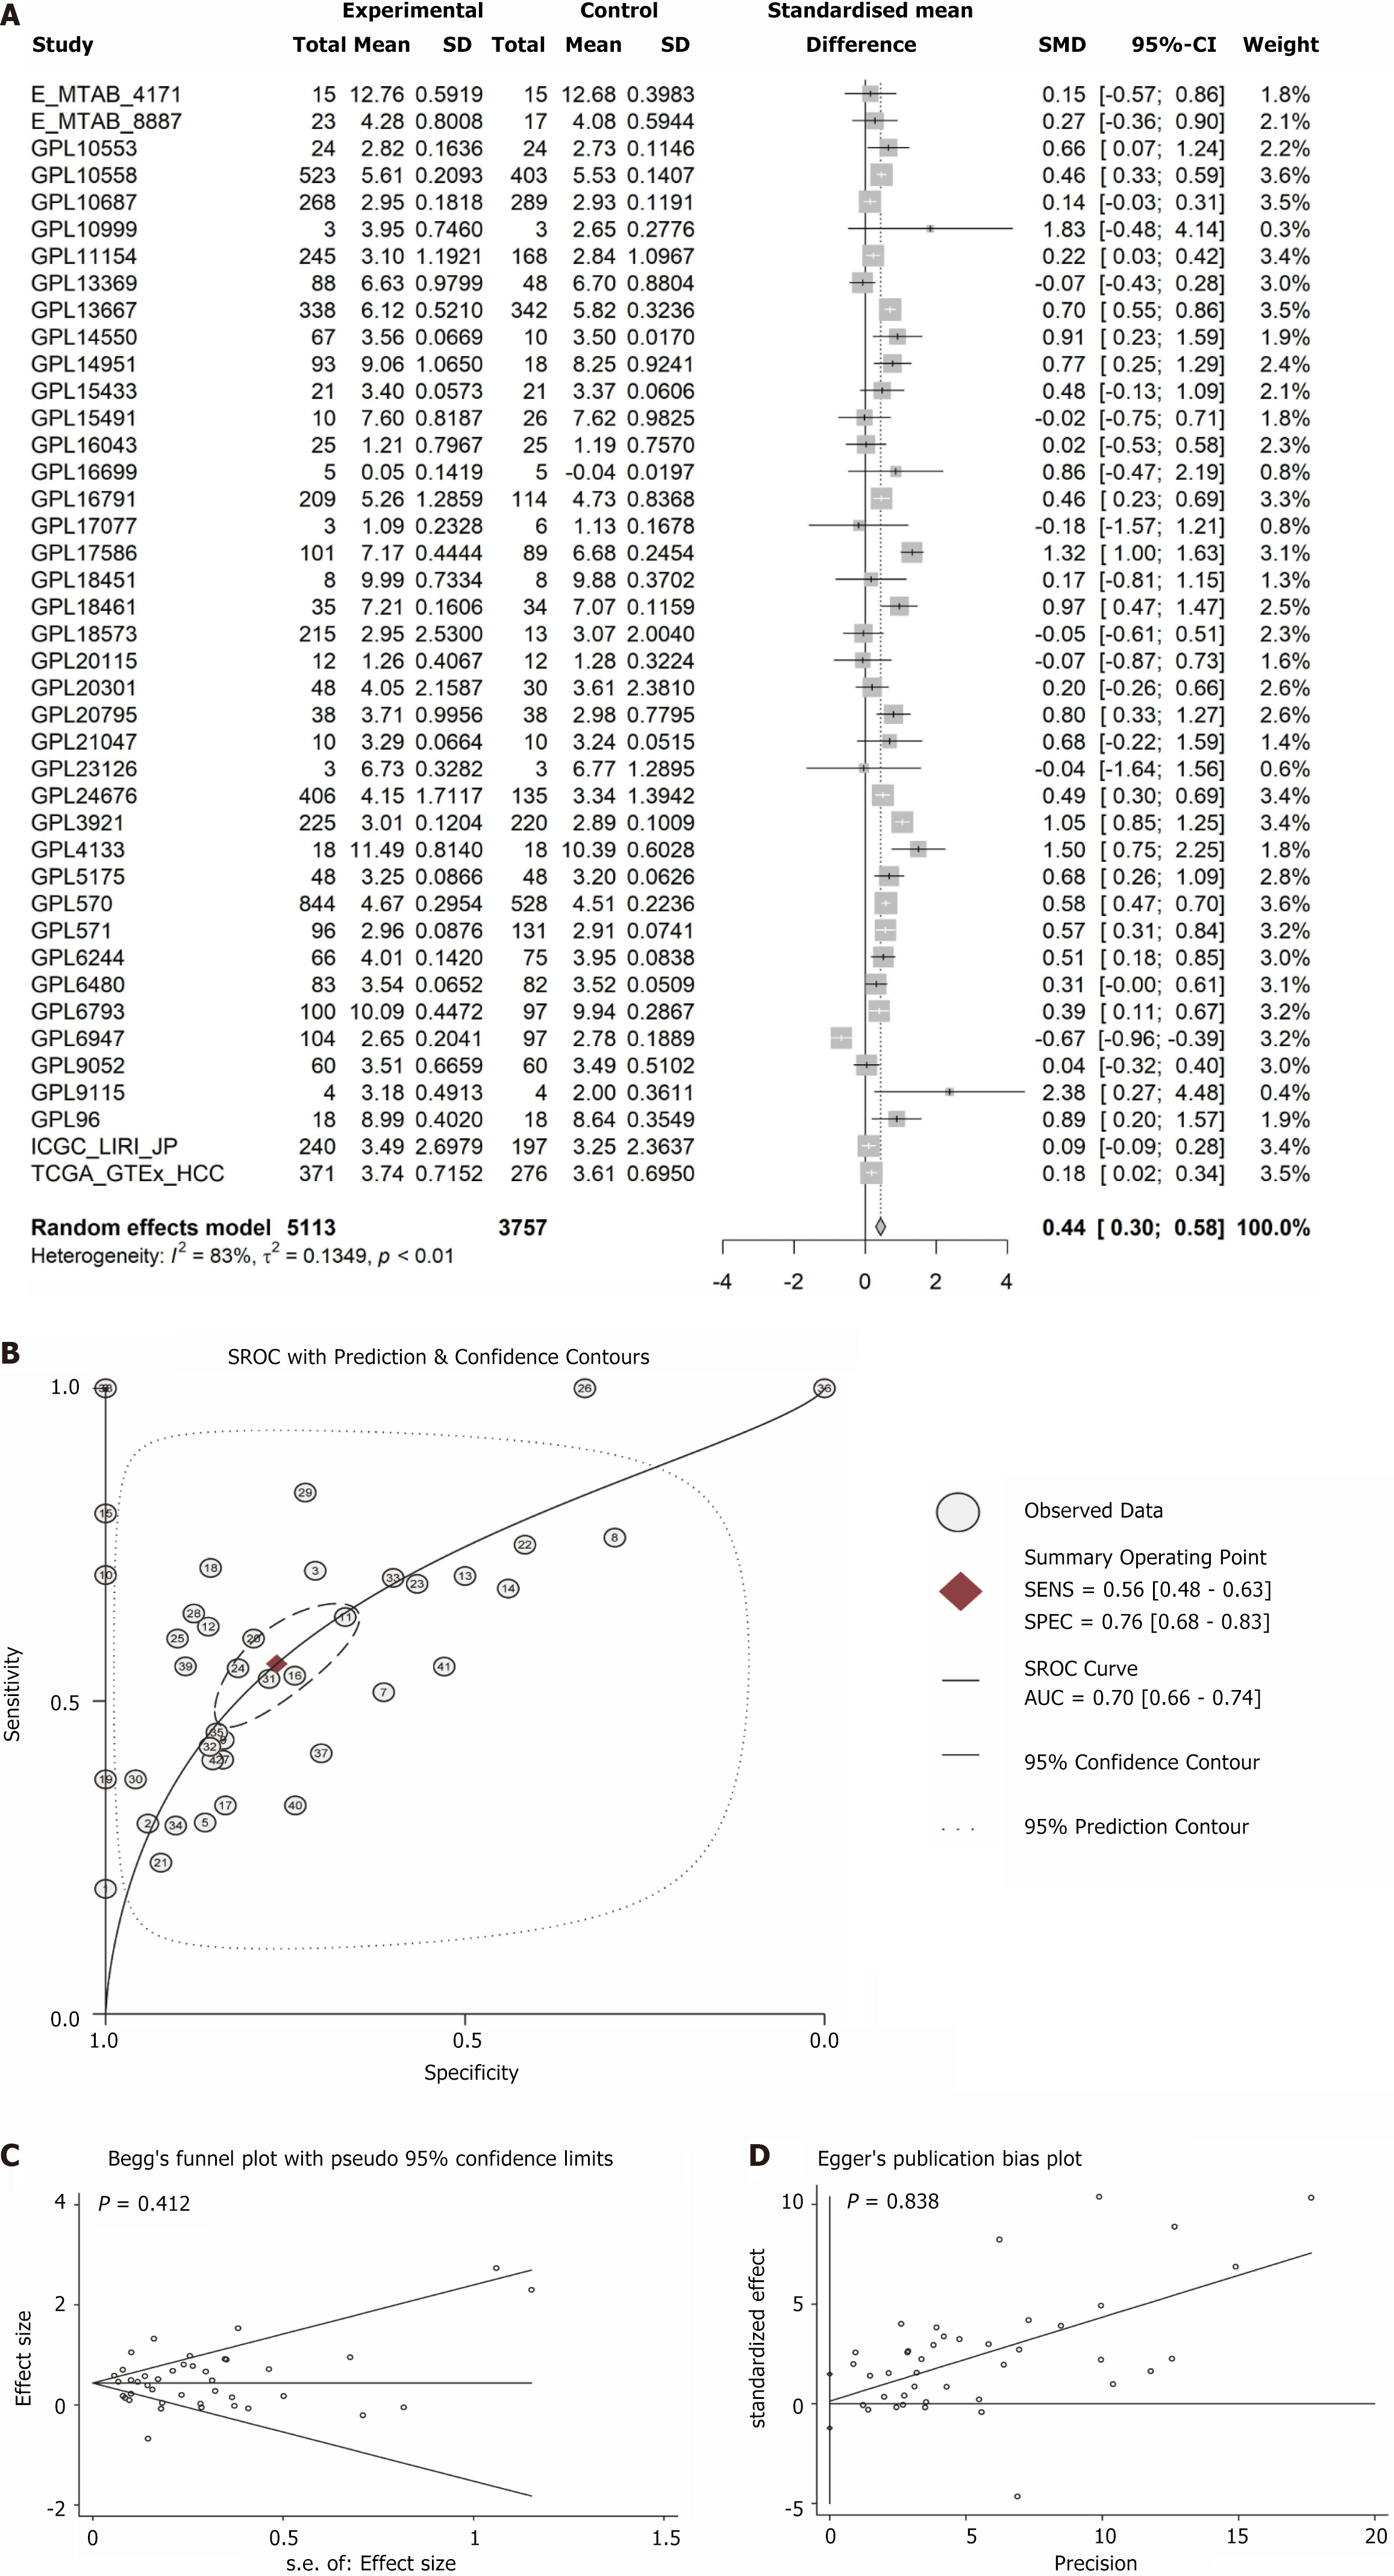
Figure 6 Integrated analysis on Rho GTPase activating protein 12 expression in hepatocellular carcinoma.
A: Forest plot; B: Summary receiver operating characteristic curve; C: Egger’s; D: Begg’s. SMD: Standardized mean difference; CI: Confidence interval; sROC: Summary receiver operating characteristic; AUC: Area under the receiver operating characteristic curve.
- Citation: Wang XW, Tang YX, Li FX, Wang JL, Yao GP, Zeng DT, Tang YL, Chi BT, Su QY, Huang LQ, Qin DY, Chen G, Feng ZB, He RQ. Clinical significance of upregulated Rho GTPase activating protein 12 causing resistance to tyrosine kinase inhibitors in hepatocellular carcinoma. World J Gastrointest Oncol 2024; 16(10): 4244-4263
- URL: https://www.wjgnet.com/1948-5204/full/v16/i10/4244.htm
- DOI: https://dx.doi.org/10.4251/wjgo.v16.i10.4244


