Copyright
©The Author(s) 2024.
World J Gastrointest Oncol. Oct 15, 2024; 16(10): 4209-4231
Published online Oct 15, 2024. doi: 10.4251/wjgo.v16.i10.4209
Published online Oct 15, 2024. doi: 10.4251/wjgo.v16.i10.4209
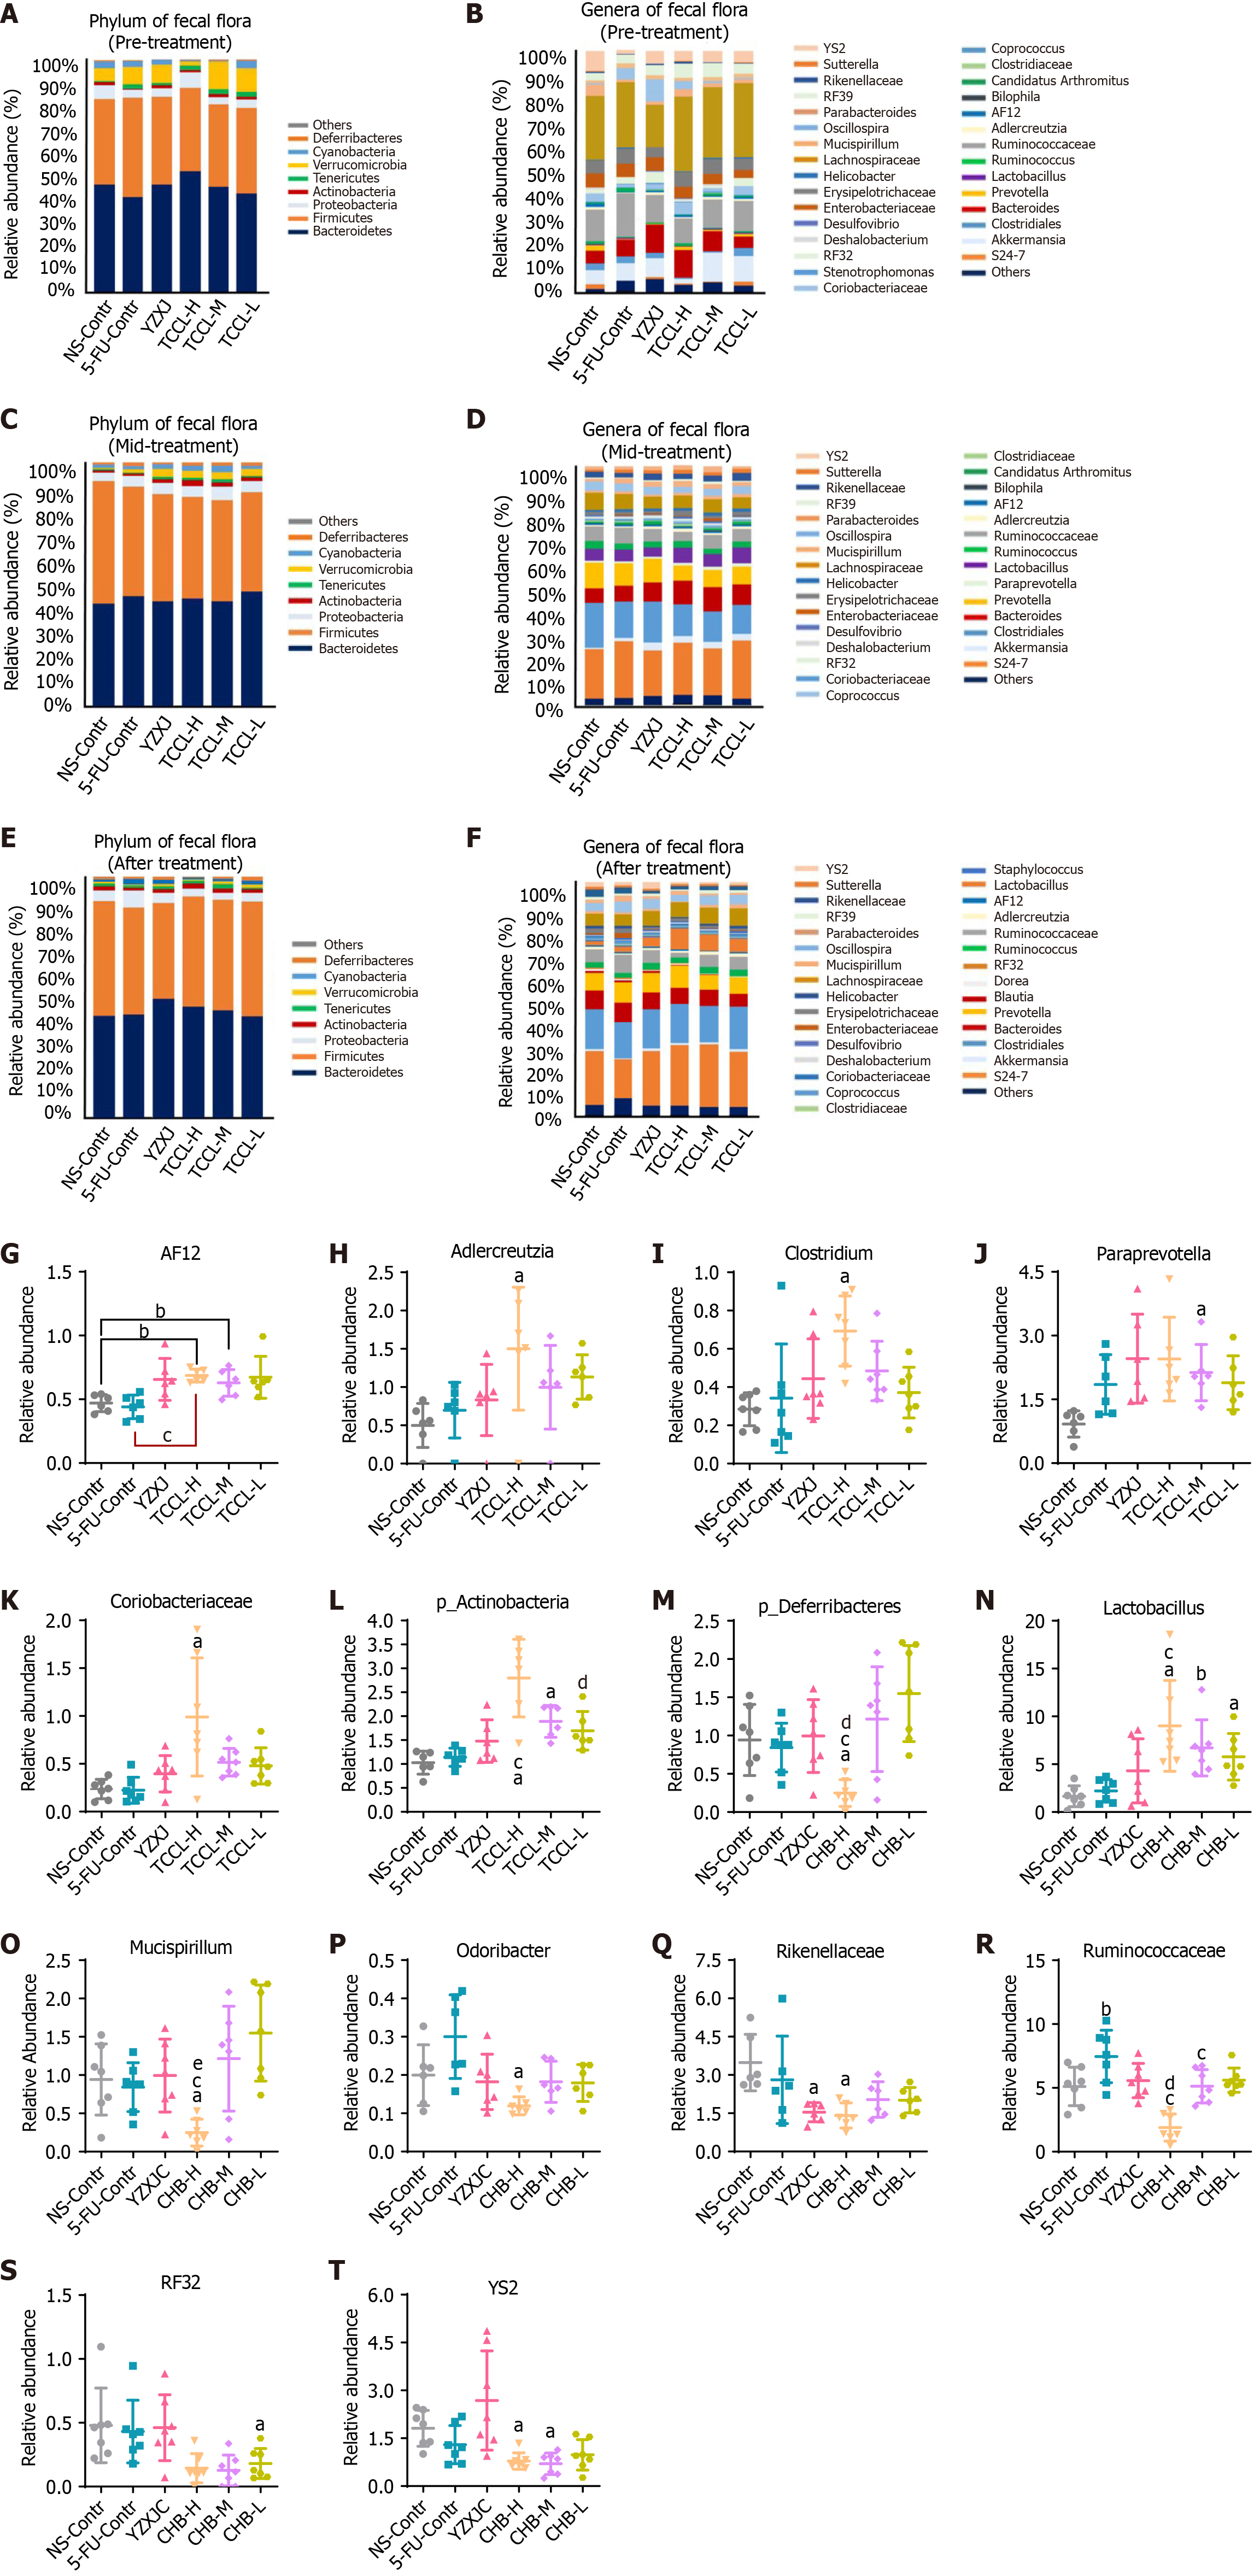
Figure 9 Histograms showing the flora structure of the top eight taxonomic dominant species and the top 30 genus dominant species in fecal samples (with other species having a relative abundance < 1%).
A-F: Different microbial species are represented by different colors; the horizontal axis denotes the experimental groups and the vertical axis represents the relative abundance of each species. The histograms highlight the significantly different microbiota between groups in fecal samples during the mid-treatment stage or after treatment. Fecal flora at the phylum level pre-treatment (A), genus level pre-treatment (B), phylum level mid-treatment (C), genus level mid-treatment (D), phylum level after treatment (E), and genus level after treatment (F); G-L: Relative abundance of AF12 (G), Adlercreutzia (H), Clostridium (I), Paraprevotella (J), Coriobacteriaceae (K) and p_Actinobacteria (L) in different groups mid-treatment; M-T: Relative abundance of p_Deferribacteres (M), Lactobacillus (N), Mucispirillum (O), Odoribacter (P), Rikenellaceae (Q), Ruminococcaceae (R), RF32 (S), and YS2 (T) in different groups after treatment. Data with error bars are represented as the mean ± SD (n = 6 or 7). aP< 0.05 vs NS-Contr; bP < 0.01 vs NS-Contr; cP < 0.05 vs 5-fluorouracil-Contr; eP < 0.05 vs Yangzhengxiaoji capsules, one-way ANOVA. 5-FU: 5-fluorouracil; YZXJ: Yangzhengxiaoji capsules; TCCL-H: High-dose Tzu-Chi cancer-antagonizing & life-protecting II decoction; TCCL-M: Medium-dose Tzu-Chi cancer-antagonizing & life-protecting II decoction; TCCL-L: Low-dose Tzu-Chi cancer-antagonizing & life-protecting II decoction.
- Citation: Wang YN, Zhai XY, Wang Z, Gao CL, Mi SC, Tang WL, Fu XM, Li HB, Yue LF, Li PF, Xi SY. Jianpi-Huatan-Huoxue-Anshen formula ameliorates gastrointestinal inflammation and microecological imbalance in chemotherapy-treated mice transplanted with H22 hepatocellular carcinoma. World J Gastrointest Oncol 2024; 16(10): 4209-4231
- URL: https://www.wjgnet.com/1948-5204/full/v16/i10/4209.htm
- DOI: https://dx.doi.org/10.4251/wjgo.v16.i10.4209


