Copyright
©The Author(s) 2024.
World J Gastrointest Oncol. Oct 15, 2024; 16(10): 4209-4231
Published online Oct 15, 2024. doi: 10.4251/wjgo.v16.i10.4209
Published online Oct 15, 2024. doi: 10.4251/wjgo.v16.i10.4209
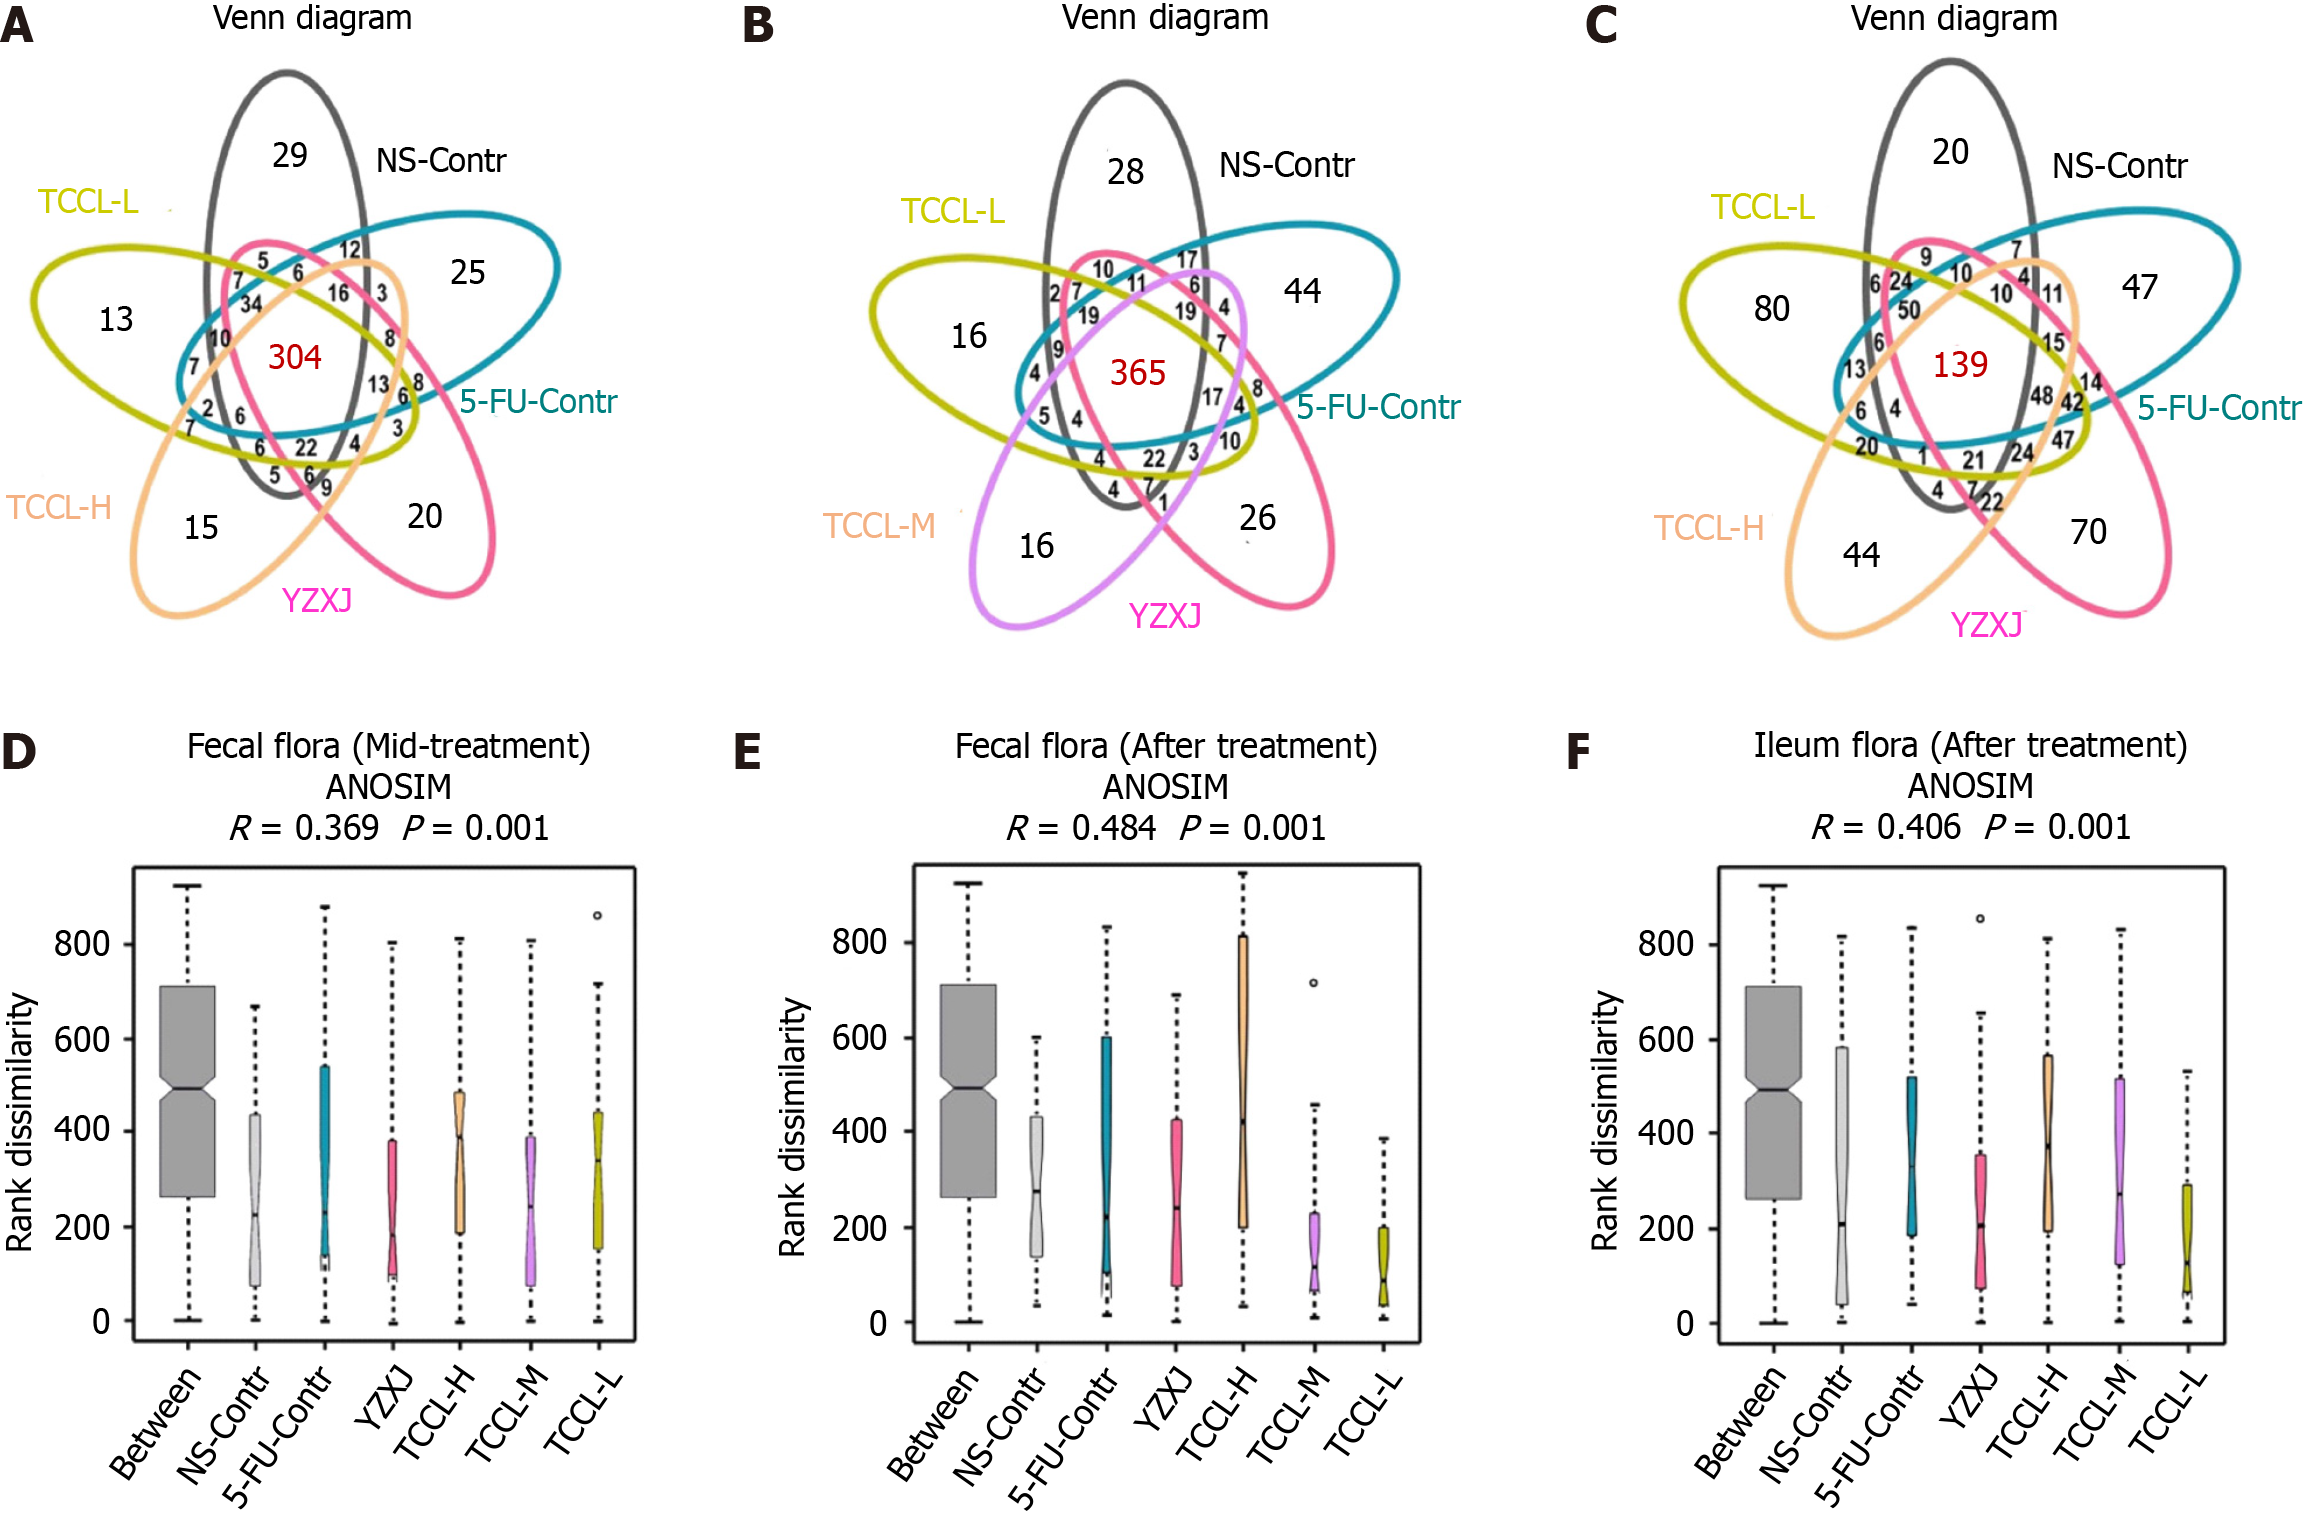
Figure 8 Venn diagrams and analysis of similarities in mid-treatment stage or after Tzu-Chi cancer-antagonizing & life-protecting II decoction treatment.
A-C: Venn diagrams of mice feces in the mid-treatment stage (A), mice feces after treatment (B), and mice ileal contents after treatment (C); D-F: Venn diagrams showing the unique and shared operational taxonomic units (OTUs). Different colors indicate different groups, and the number in the middle of the graph represents the number of OTUs. The overlapping areas represent the core microbiome. Analysis of similarities in mice feces in the mid-treatment stage (D), in mice feces after treatment (E), and in mice ileal contents after treatment (F). Data with error bars are represented as the mean ± SD (n = 6 or 7). The x-coordinate represents all samples (between) and each group and the y-coordinate represents the rank of the distance.
- Citation: Wang YN, Zhai XY, Wang Z, Gao CL, Mi SC, Tang WL, Fu XM, Li HB, Yue LF, Li PF, Xi SY. Jianpi-Huatan-Huoxue-Anshen formula ameliorates gastrointestinal inflammation and microecological imbalance in chemotherapy-treated mice transplanted with H22 hepatocellular carcinoma. World J Gastrointest Oncol 2024; 16(10): 4209-4231
- URL: https://www.wjgnet.com/1948-5204/full/v16/i10/4209.htm
- DOI: https://dx.doi.org/10.4251/wjgo.v16.i10.4209


