Copyright
©The Author(s) 2024.
World J Gastrointest Oncol. Oct 15, 2024; 16(10): 4209-4231
Published online Oct 15, 2024. doi: 10.4251/wjgo.v16.i10.4209
Published online Oct 15, 2024. doi: 10.4251/wjgo.v16.i10.4209
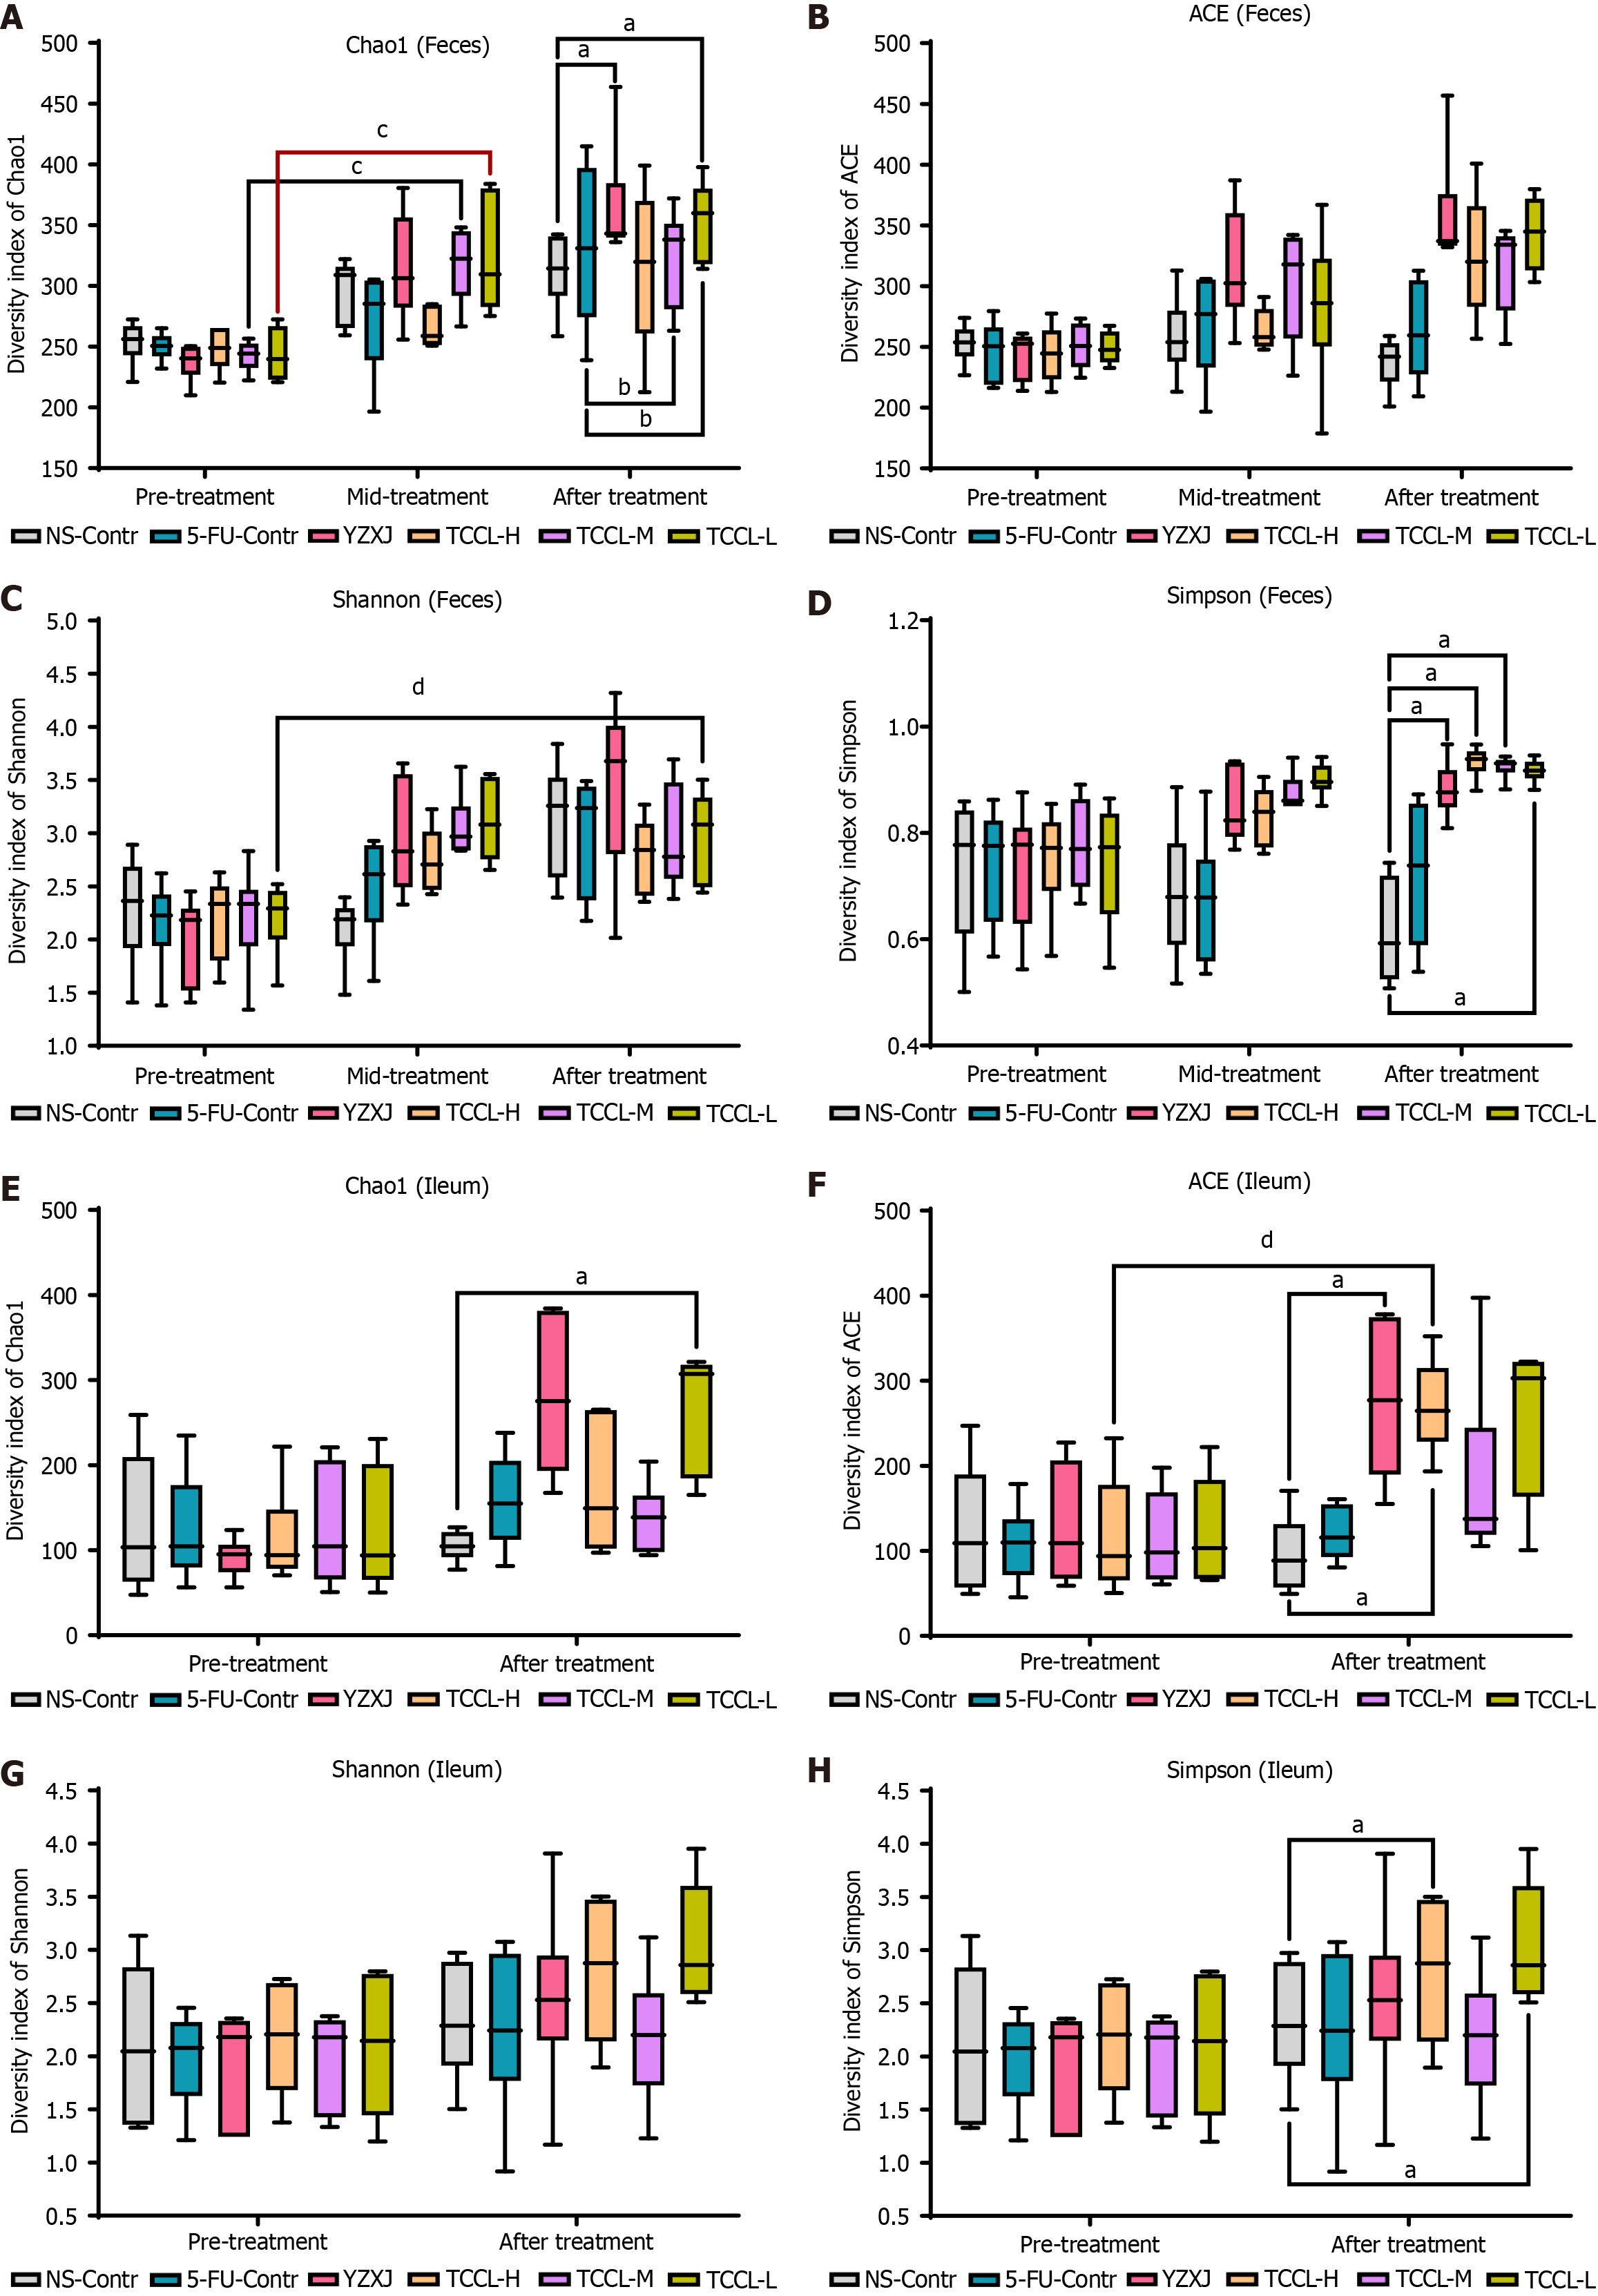
Figure 7 Effects of Tzu-Chi cancer-antagonizing & life-protecting II decoction on microbial community richness, evenness, and diversity in fecal samples and ileal contents.
The horizontal axis represents the groups and the different treatment periods and the vertical axis represents the various alpha indices. A-D: Fecal flora values of Chao1 (A), ACE (B), Shannon (C), and Simpson (D); E-H: Ileum microflora values of Chao1 (E), ACE (F), Shannon (G), and Simpson (H). Data with error bars are represented as the mean ± SD (n = 6). aP< 0.05 vs NS-Contr; bP < 0.05 vs 5-fluorouracil-Contr; cP < 0.05 pre-treatment vs mid-treatment; dP < 0.05 pre-treatment vs after treatment, one-way ANOVA. 5-FU: 5-fluorouracil; YZXJ: Yangzhengxiaoji capsules; TCCL-H: High-dose Tzu-Chi cancer-antagonizing & life-protecting II decoction; TCCL-M: Medium-dose Tzu-Chi cancer-antagonizing & life-protecting II decoction; TCCL-L: Low-dose Tzu-Chi cancer-antagonizing & life-protecting II decoction.
- Citation: Wang YN, Zhai XY, Wang Z, Gao CL, Mi SC, Tang WL, Fu XM, Li HB, Yue LF, Li PF, Xi SY. Jianpi-Huatan-Huoxue-Anshen formula ameliorates gastrointestinal inflammation and microecological imbalance in chemotherapy-treated mice transplanted with H22 hepatocellular carcinoma. World J Gastrointest Oncol 2024; 16(10): 4209-4231
- URL: https://www.wjgnet.com/1948-5204/full/v16/i10/4209.htm
- DOI: https://dx.doi.org/10.4251/wjgo.v16.i10.4209


