Copyright
©The Author(s) 2024.
World J Gastrointest Oncol. Oct 15, 2024; 16(10): 4157-4165
Published online Oct 15, 2024. doi: 10.4251/wjgo.v16.i10.4157
Published online Oct 15, 2024. doi: 10.4251/wjgo.v16.i10.4157
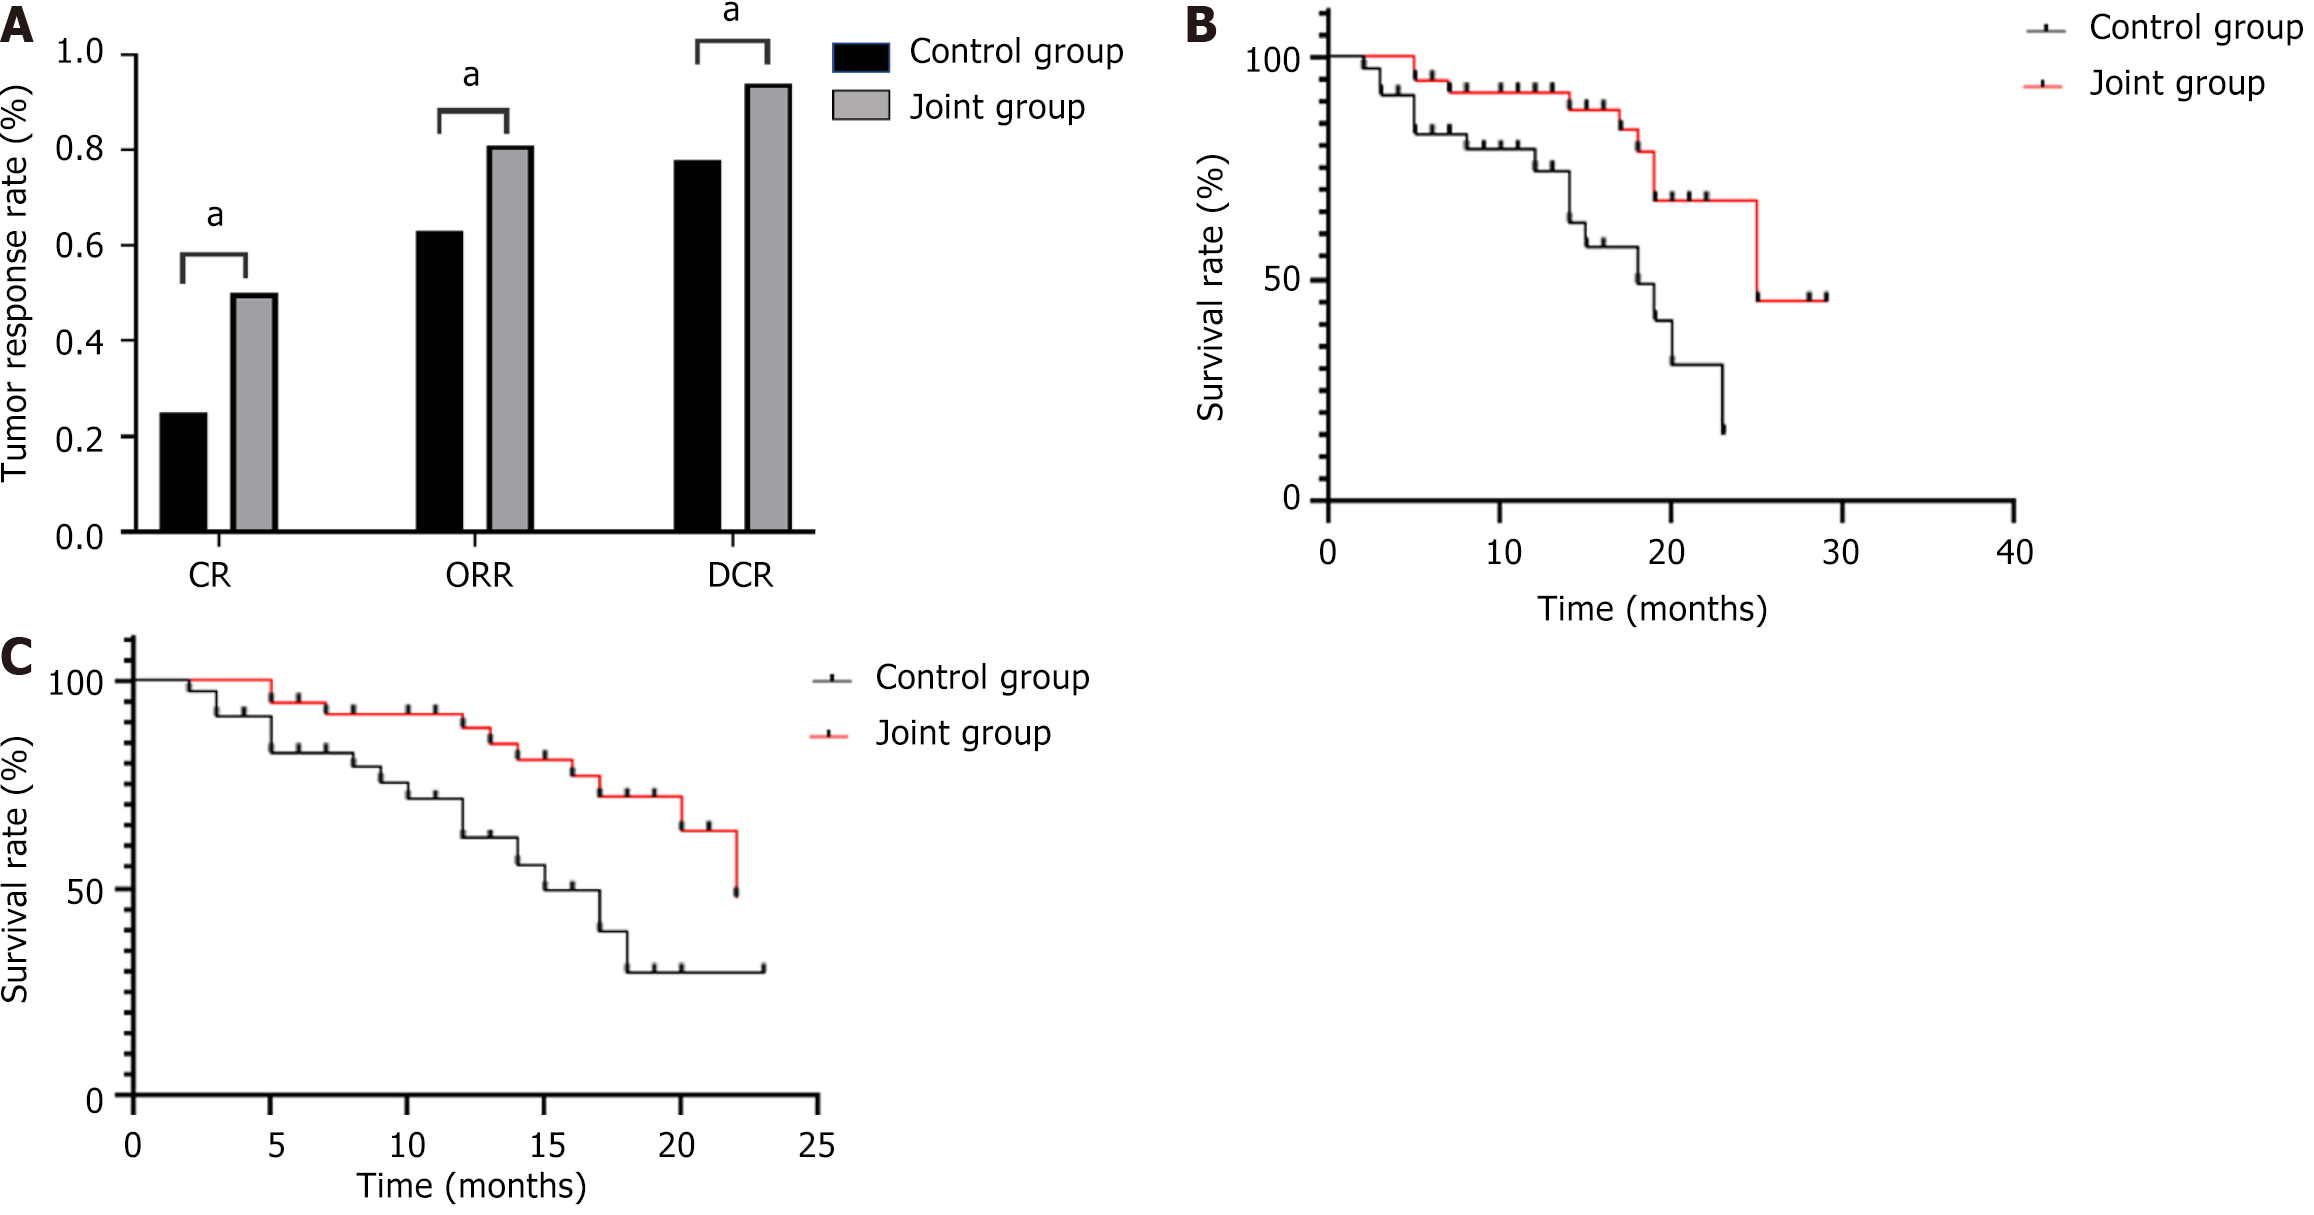
Figure 1 Tumor response 1 month after surgery in the two groups and survival curve graph.
A: Tumor response 1-month postoperatively in the two groups. aP < 0.05; B: Survival curve graph of overall survival in both groups; C: Survival curve graph of progression-free survival in both groups. CR: Complete response; DCR: Disease control rate; ORR: Objective response rate.
- Citation: Qi JS, Zhao P, Zhao XB, Zhao YL, Guo YC. Small particle drug-eluting beads-transarterial chemoembolization combined with targeted therapy in the clinical treatment of unresectable liver cancer. World J Gastrointest Oncol 2024; 16(10): 4157-4165
- URL: https://www.wjgnet.com/1948-5204/full/v16/i10/4157.htm
- DOI: https://dx.doi.org/10.4251/wjgo.v16.i10.4157


