Copyright
©The Author(s) 2024.
World J Gastrointest Oncol. Oct 15, 2024; 16(10): 4115-4128
Published online Oct 15, 2024. doi: 10.4251/wjgo.v16.i10.4115
Published online Oct 15, 2024. doi: 10.4251/wjgo.v16.i10.4115
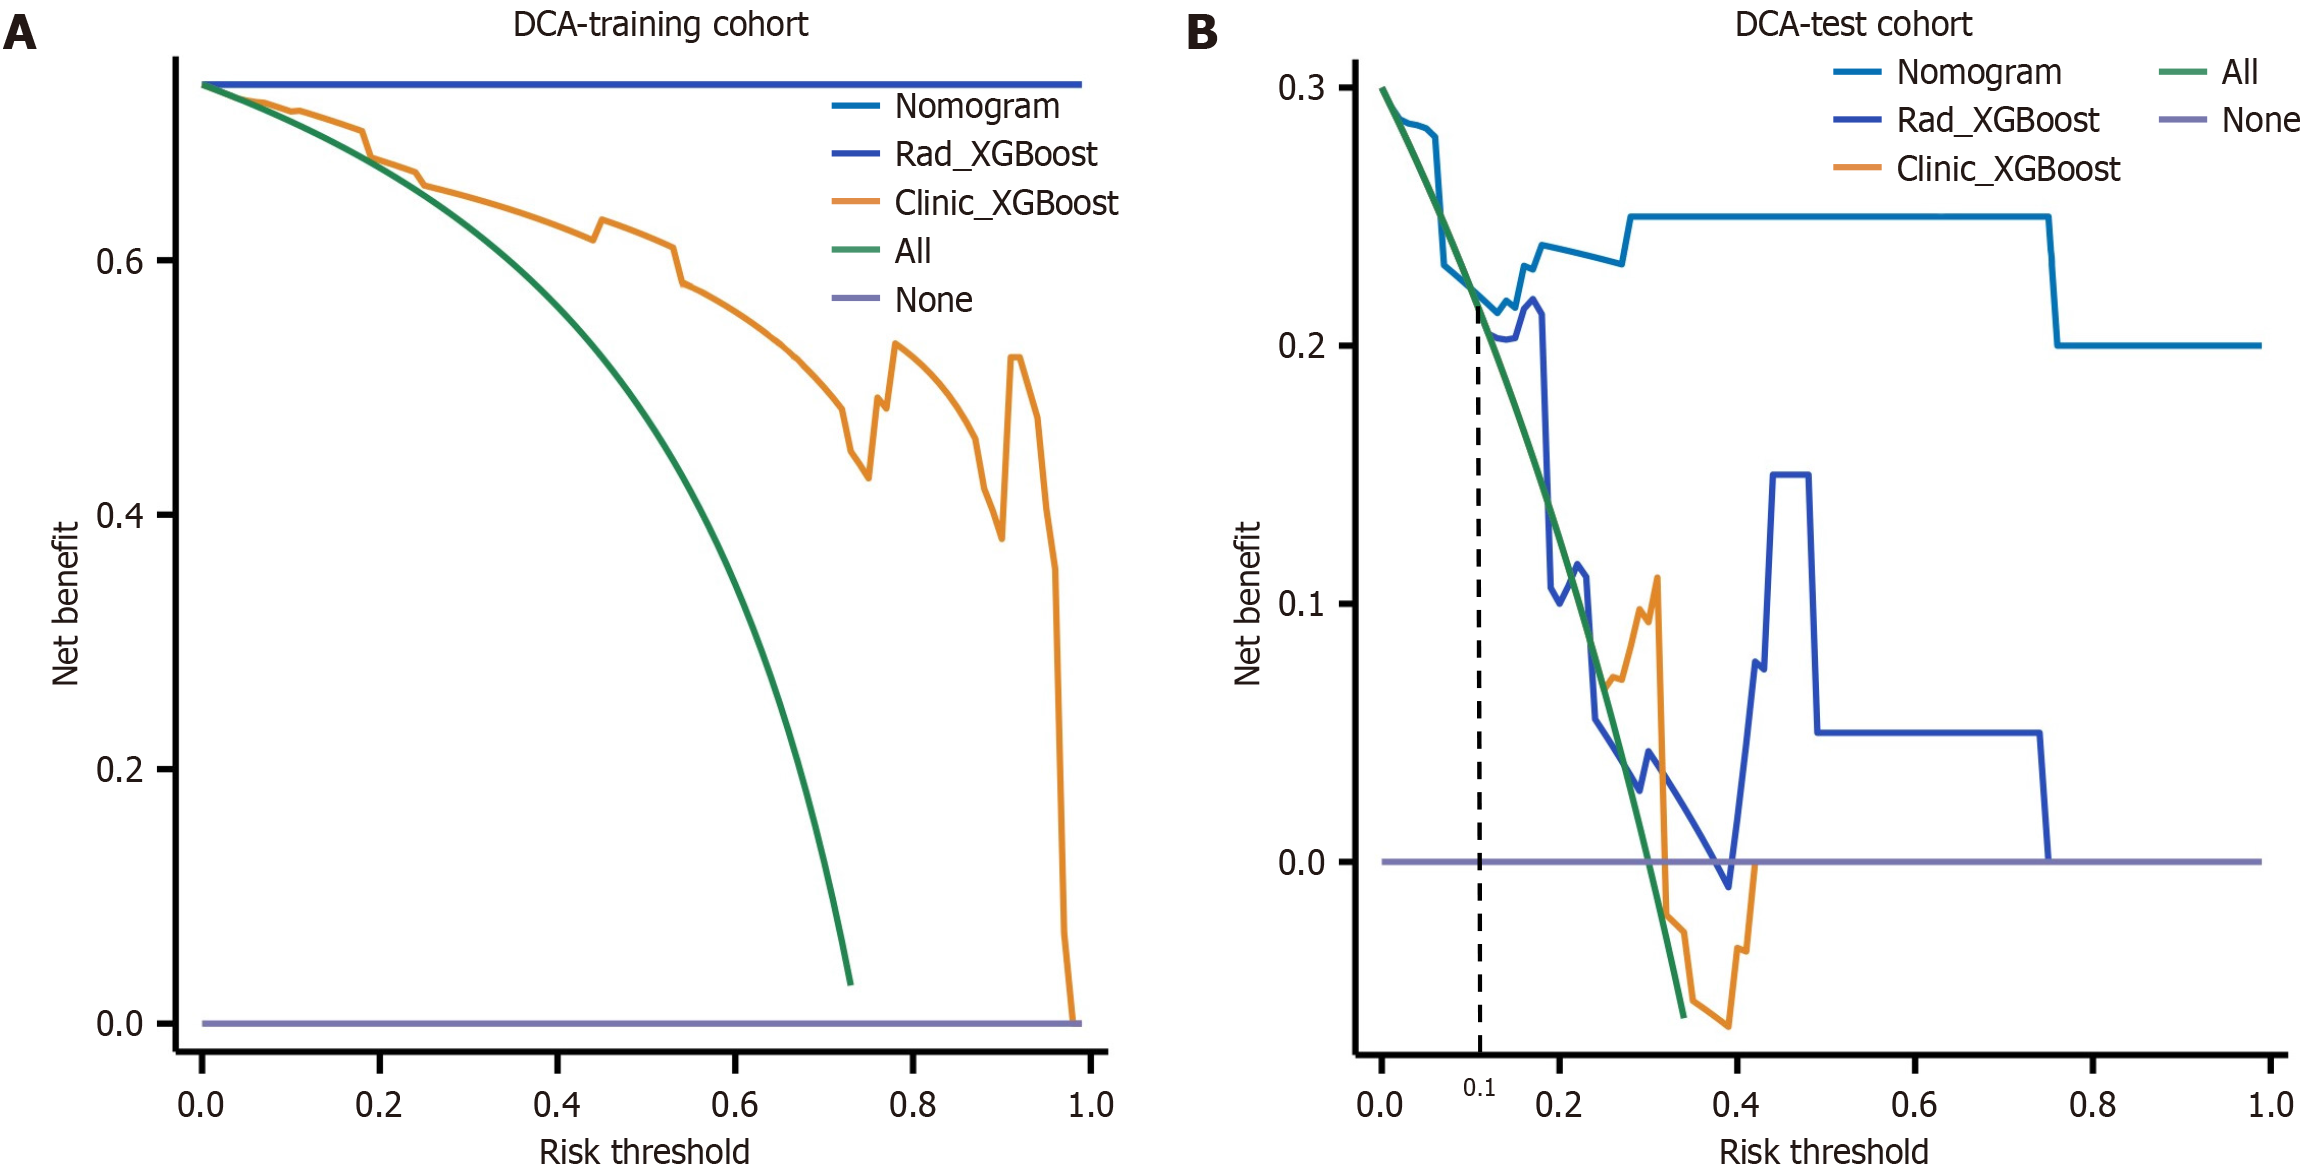
Figure 7 Decision curves were generated to compare the differences in the net benefit of the various models.
A: Decision curves in the training cohort; B: Decision curves in the test cohort. The X-axis indicates the threshold probability, and the Y-axis indicates the net benefit. The decision curve revealed that when the threshold probability exceeded 10%, the net benefit of the clinical application of the nomogram exceeded that of the other models in the test cohort. XGBoost: EXtreme gradient boosting; DCA: Decision curve analysis.
- Citation: Zhang J, Wang Q, Guo TH, Gao W, Yu YM, Wang RF, Yu HL, Chen JJ, Sun LL, Zhang BY, Wang HJ. Computed tomography-based radiomic model for the prediction of neoadjuvant immunochemotherapy response in patients with advanced gastric cancer. World J Gastrointest Oncol 2024; 16(10): 4115-4128
- URL: https://www.wjgnet.com/1948-5204/full/v16/i10/4115.htm
- DOI: https://dx.doi.org/10.4251/wjgo.v16.i10.4115


