Copyright
©The Author(s) 2024.
World J Gastrointest Oncol. Oct 15, 2024; 16(10): 4115-4128
Published online Oct 15, 2024. doi: 10.4251/wjgo.v16.i10.4115
Published online Oct 15, 2024. doi: 10.4251/wjgo.v16.i10.4115
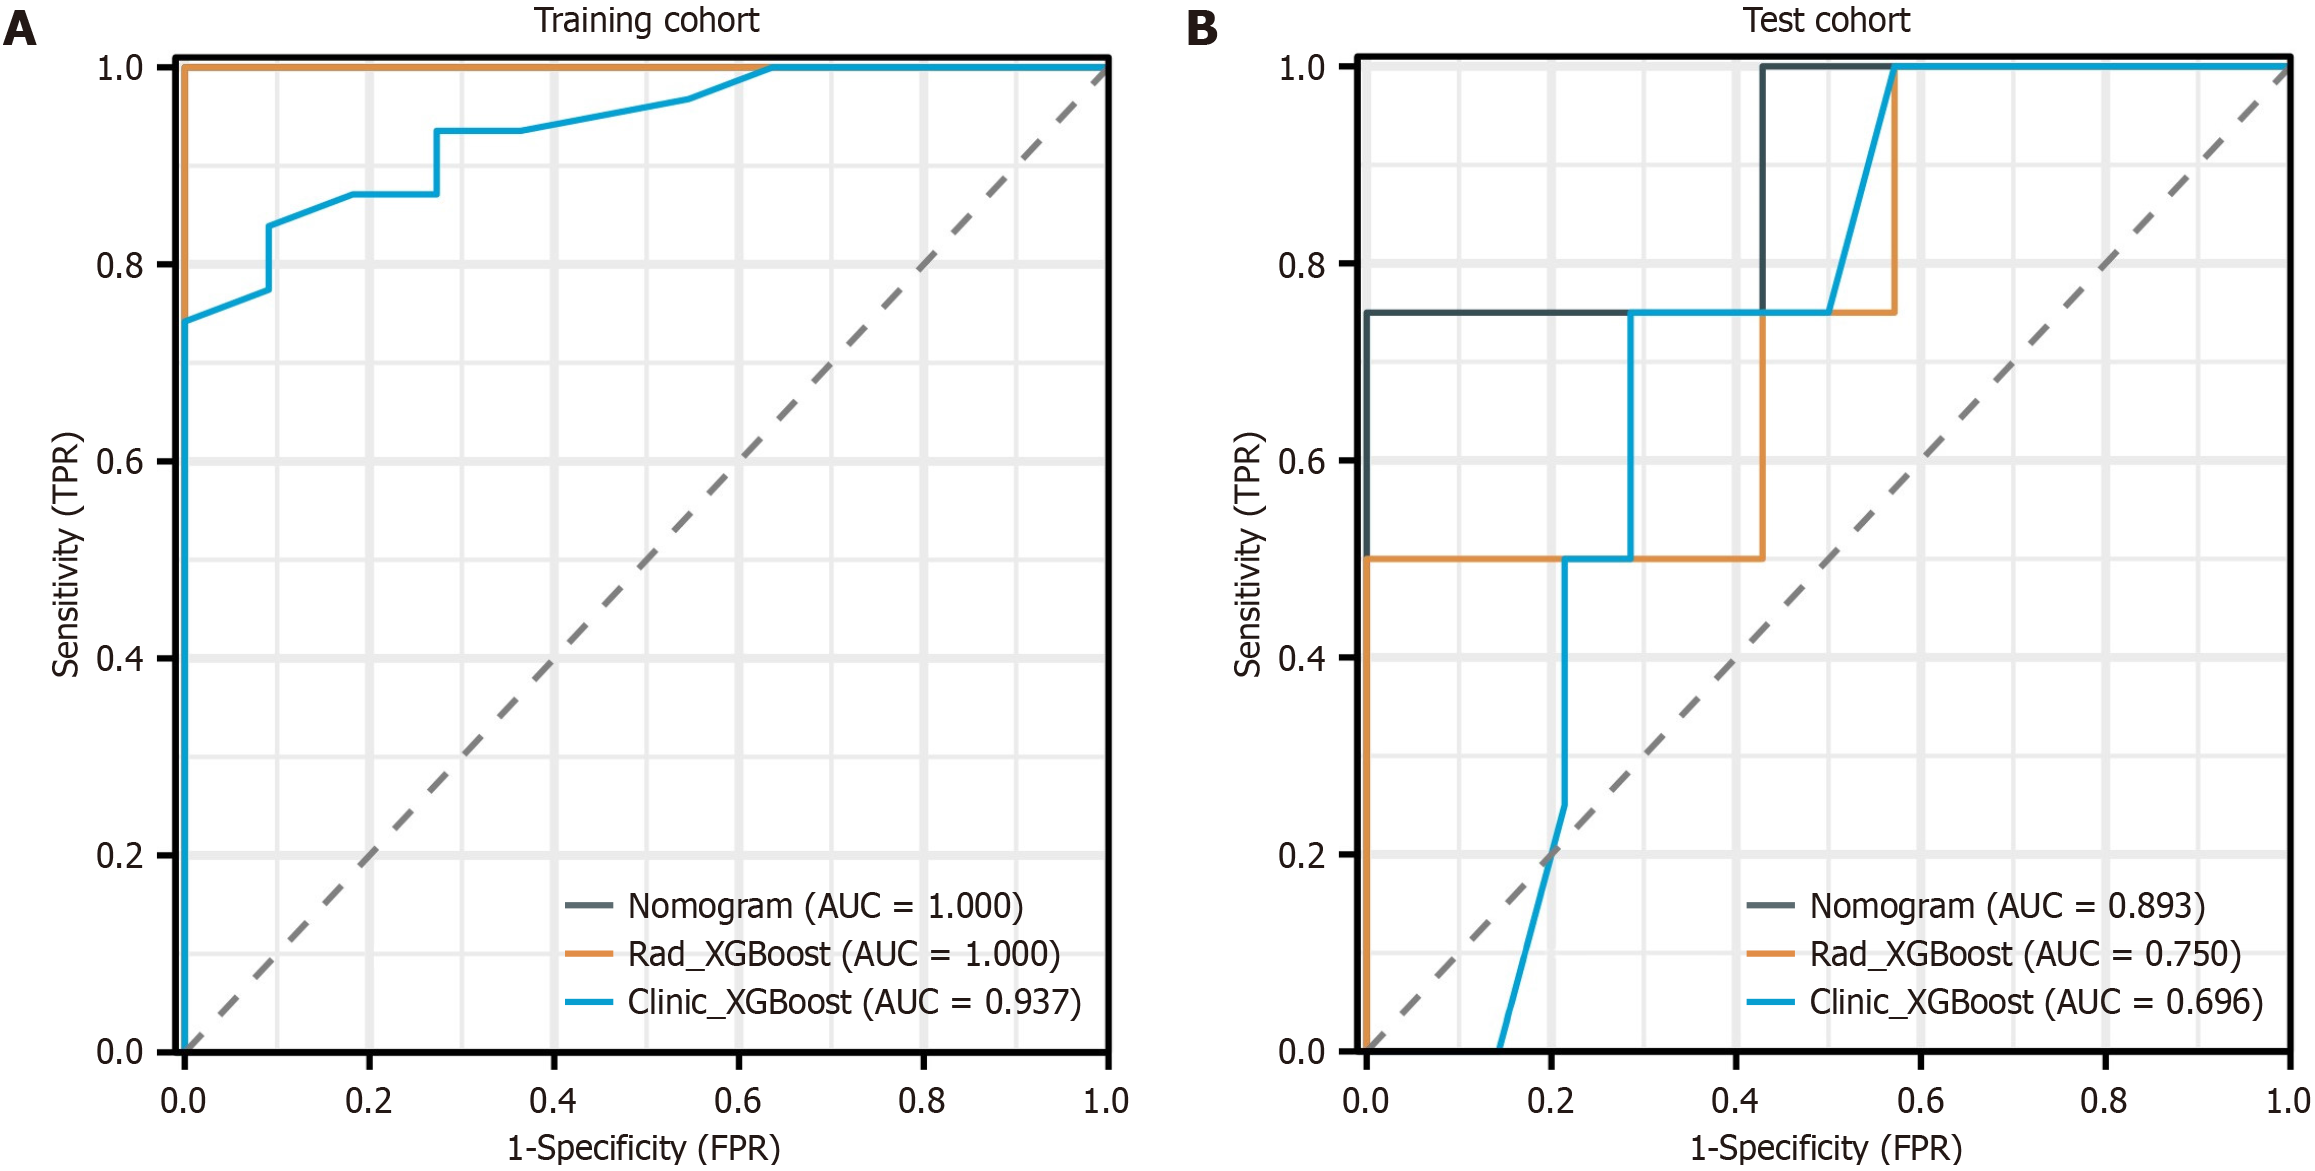
Figure 6 Operating characteristic curve analysis of the nomogram.
A: Area under the curve (AUC) of 1.000 [95% confidence interval (CI): 1.000-1.000] in the training cohort of the nomogram; B: AUC of 0.893 (95%CI: 0.803-0.991) in the test cohort of the nomogram. The operating characteristic curves revealed that the AUCs of the nomogram were superior to those of both the radiomic signature and the clinical signature. AUC: Area under the curve; XGBoost: EXtreme gradient boosting; TPR: True positive rate; FPR: False positive rate.
- Citation: Zhang J, Wang Q, Guo TH, Gao W, Yu YM, Wang RF, Yu HL, Chen JJ, Sun LL, Zhang BY, Wang HJ. Computed tomography-based radiomic model for the prediction of neoadjuvant immunochemotherapy response in patients with advanced gastric cancer. World J Gastrointest Oncol 2024; 16(10): 4115-4128
- URL: https://www.wjgnet.com/1948-5204/full/v16/i10/4115.htm
- DOI: https://dx.doi.org/10.4251/wjgo.v16.i10.4115


