Copyright
©The Author(s) 2024.
World J Gastrointest Oncol. Oct 15, 2024; 16(10): 4104-4114
Published online Oct 15, 2024. doi: 10.4251/wjgo.v16.i10.4104
Published online Oct 15, 2024. doi: 10.4251/wjgo.v16.i10.4104
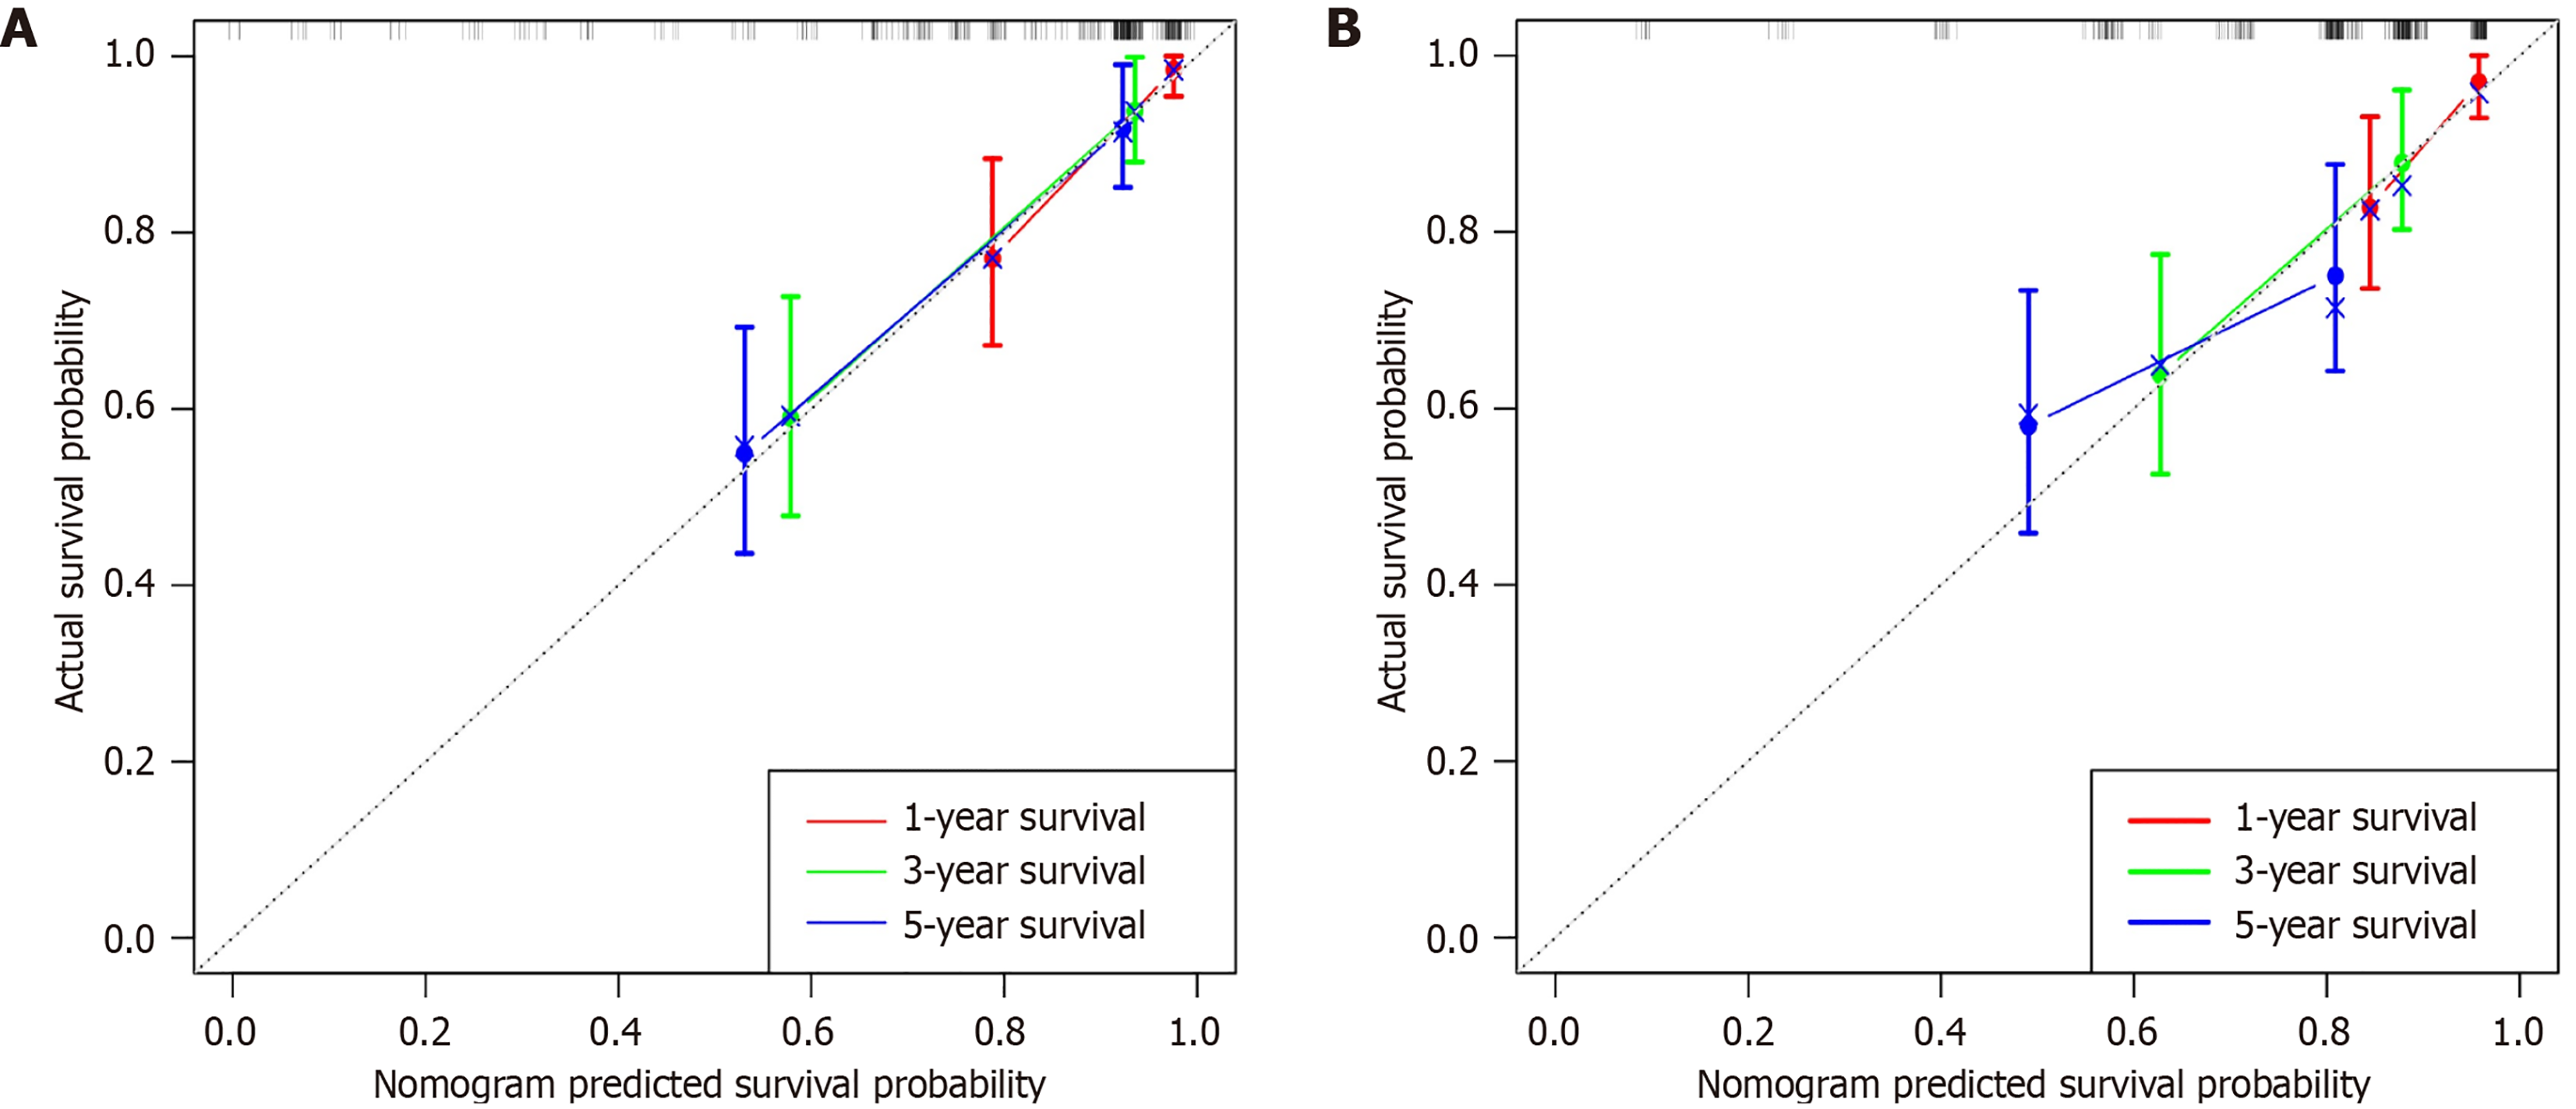
Figure 4 Calibration curves for the training and testing groups.
A: Training group; B: Testing group. The X-axis represents the survival probability predicted by the nomogram, and the Y-axis represents the actual survival. The reference line is in black. The colored lines represent the performance of the nomogram. The better the performance, the closer the colored lines are to the dotted line.
- Citation: Hu ZX, Li Y, Yang X, Li YX, He YY, Niu XH, Nie TT, Guo XF, Yuan ZL. Constructing a nomogram to predict overall survival of colon cancer based on computed tomography characteristics and clinicopathological factors. World J Gastrointest Oncol 2024; 16(10): 4104-4114
- URL: https://www.wjgnet.com/1948-5204/full/v16/i10/4104.htm
- DOI: https://dx.doi.org/10.4251/wjgo.v16.i10.4104


