Copyright
©The Author(s) 2023.
World J Gastrointest Oncol. Sep 15, 2023; 15(9): 1567-1594
Published online Sep 15, 2023. doi: 10.4251/wjgo.v15.i9.1567
Published online Sep 15, 2023. doi: 10.4251/wjgo.v15.i9.1567
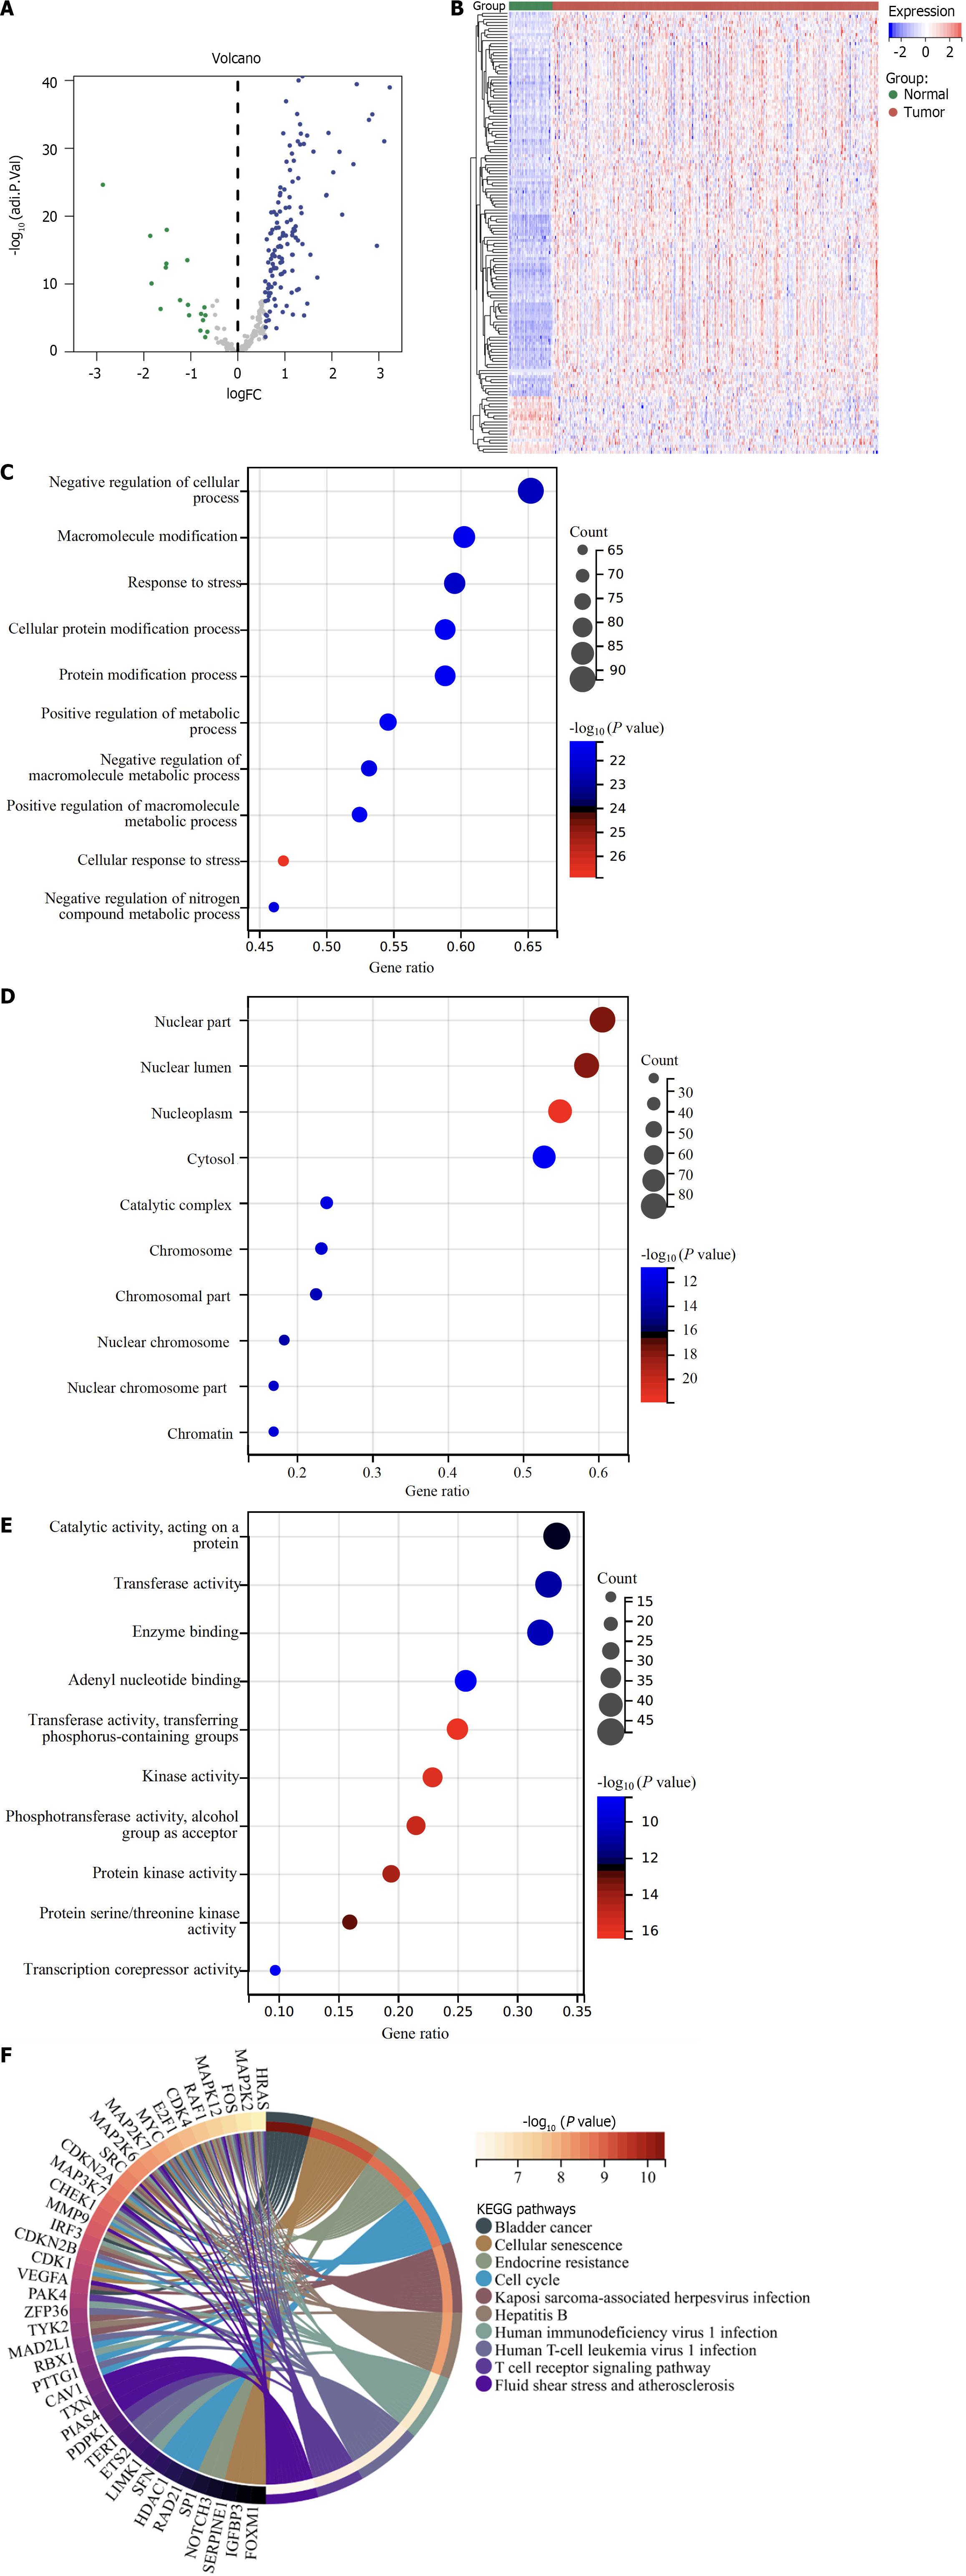
Figure 1 Differentially expressed cellular senescence genes in hepatocellular carcinoma and biological significance.
A: Volcano diagram of the abnormal expression of cellular senescence genes in hepatocellular carcinoma (HCC) relative to normal liver tissues in the TCGA-LIHC dataset. Blue dots denote differentially expressed cellular senescence genes, with grey dots for the not differentially expressed genes; B: Heatmap of the transcript levels of differentially expressed cellular senescence genes in HCC and normal liver tissues; C–E: Bubble diagrams of the top 10 biological process, cellular component, molecular function terms enriched by differentially expressed genes. The bubble size indicates the count of genes enriched. The closer the color is to red, the smaller the adjusted p; F: Circle graph of the Kyoto Encyclopedia of Genes and Genomes pathways enriched by differentially expressed genes.
- Citation: Wang HH, Chen WL, Cui YY, Gong HH, Li H. Cellular senescence throws new insights into patient classification and pharmacological interventions for clinical management of hepatocellular carcinoma. World J Gastrointest Oncol 2023; 15(9): 1567-1594
- URL: https://www.wjgnet.com/1948-5204/full/v15/i9/1567.htm
- DOI: https://dx.doi.org/10.4251/wjgo.v15.i9.1567


