Copyright
©The Author(s) 2023.
World J Gastrointest Oncol. Aug 15, 2023; 15(8): 1412-1423
Published online Aug 15, 2023. doi: 10.4251/wjgo.v15.i8.1412
Published online Aug 15, 2023. doi: 10.4251/wjgo.v15.i8.1412
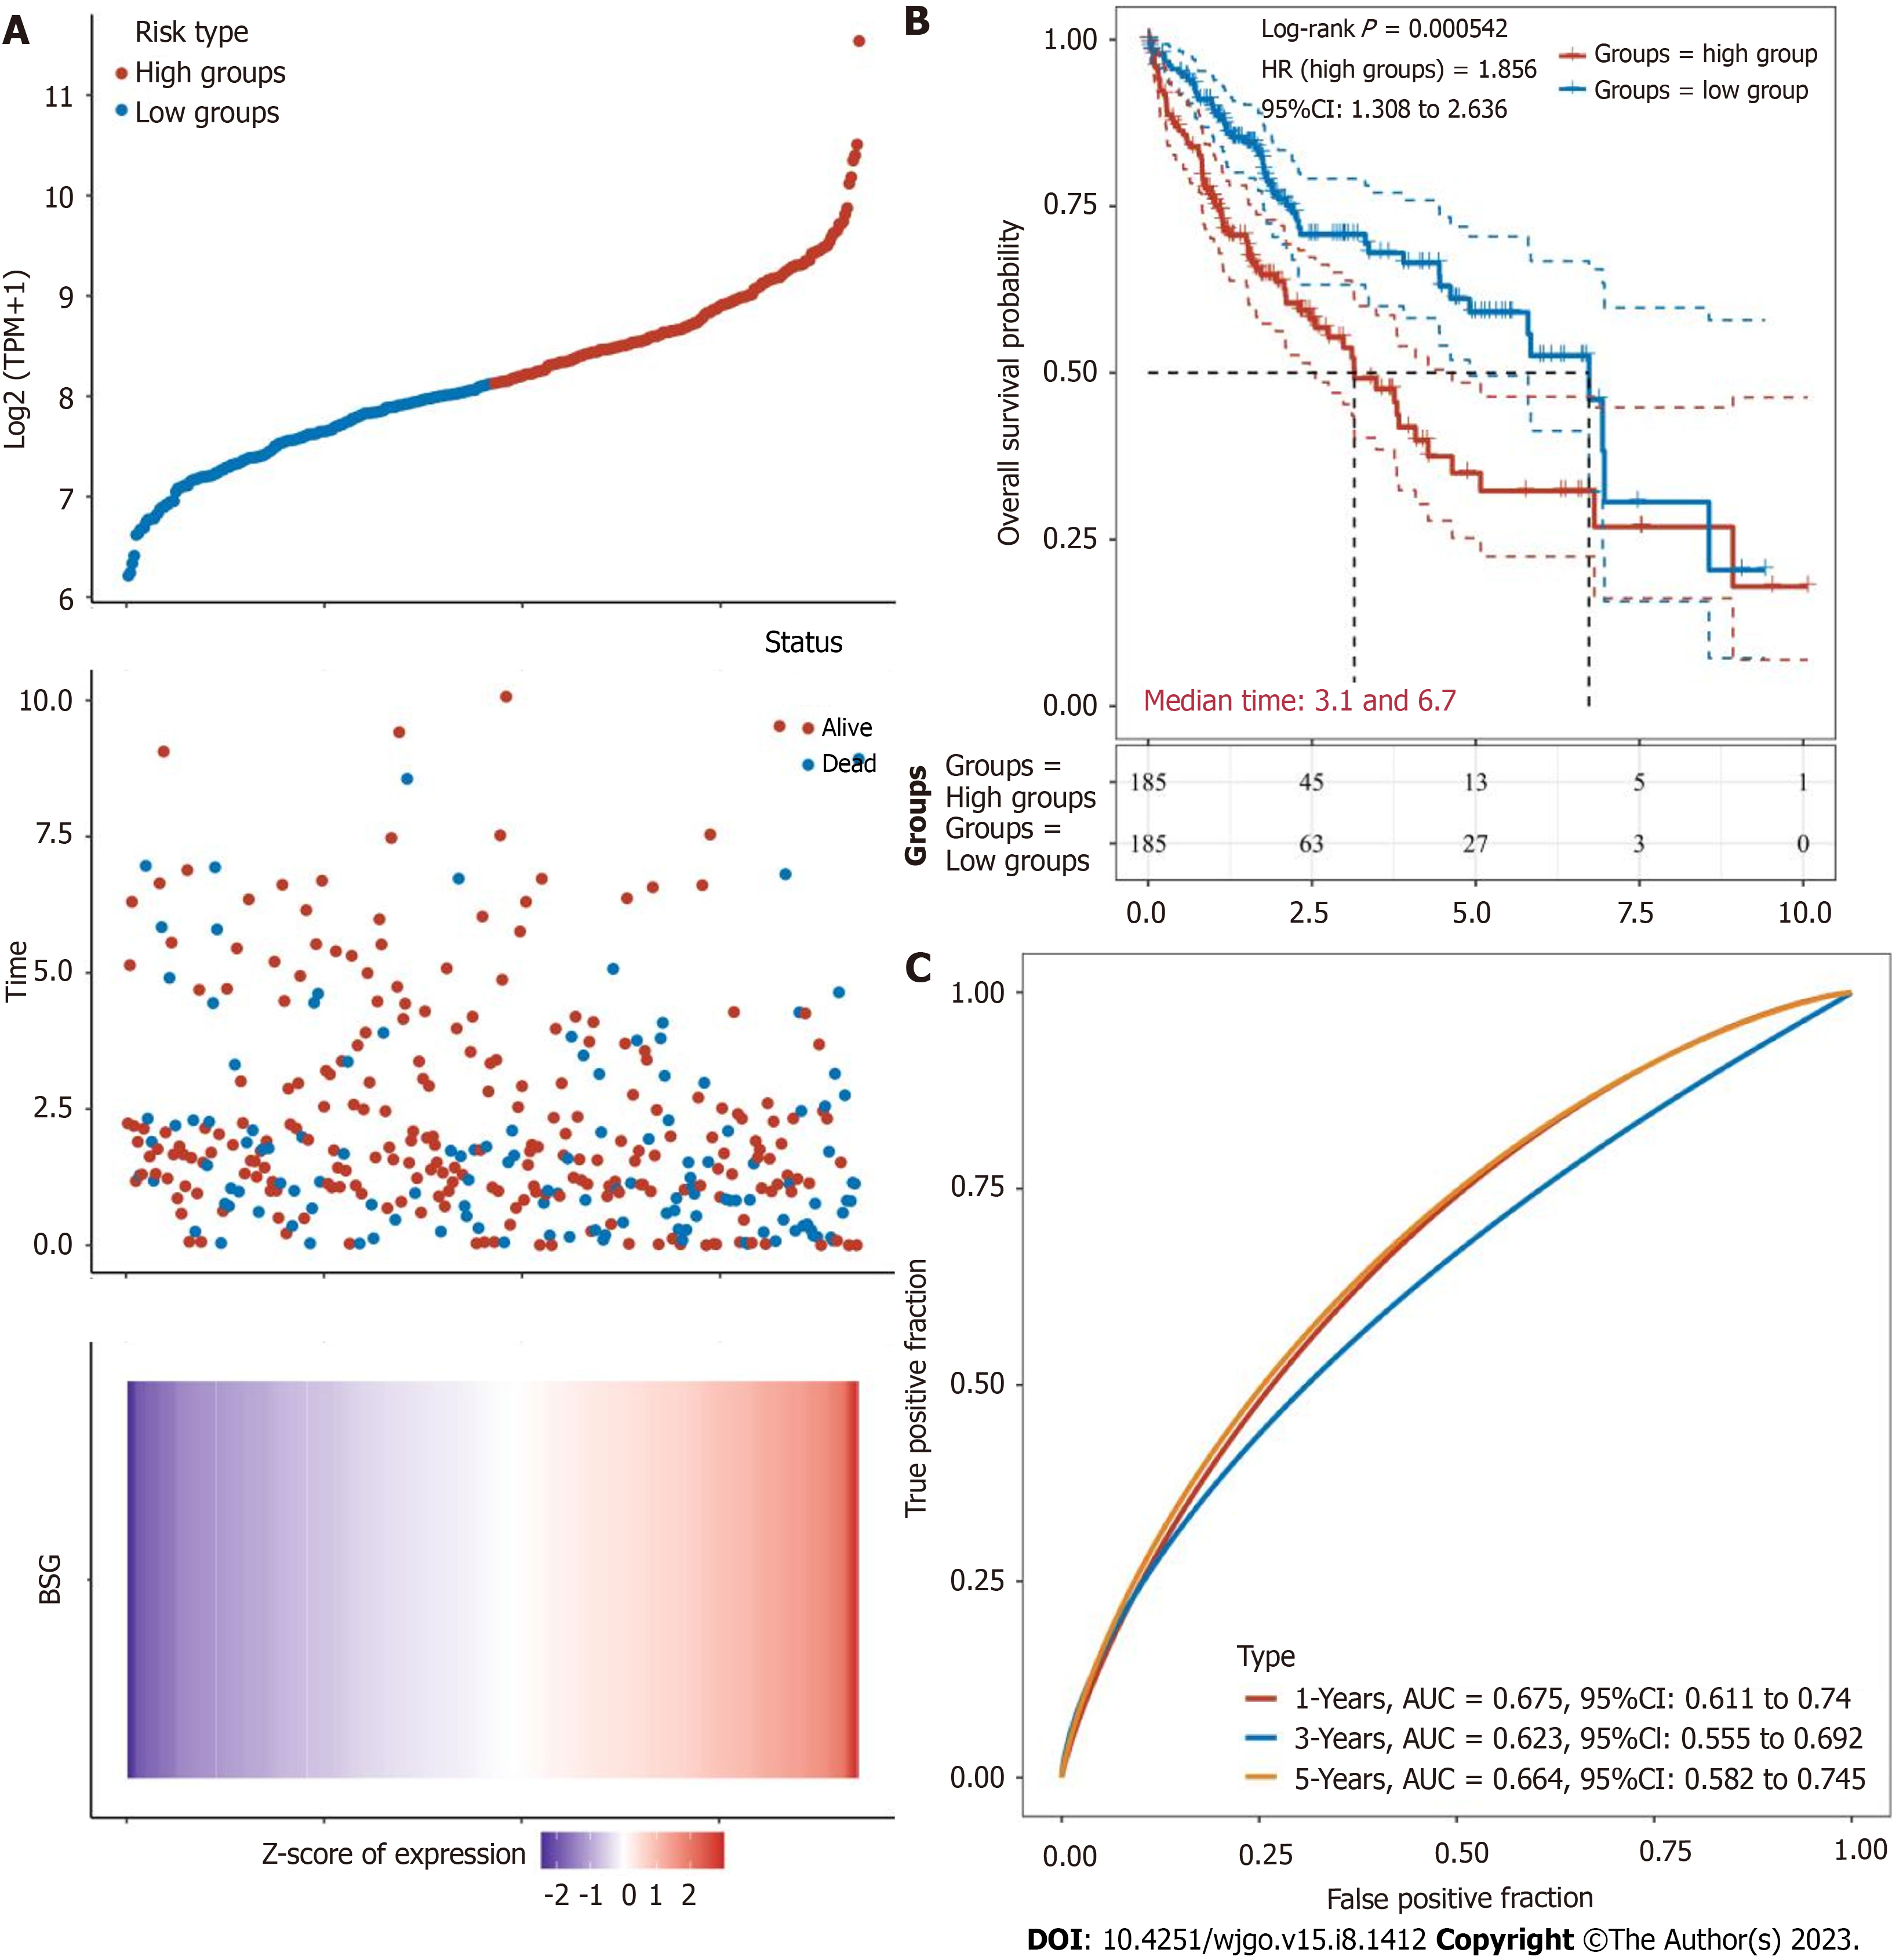
Figure 6 Kaplan-Meier curve based survival analysis in low-expression and high-expression groups of cluster of differentiation 147 conducted by the log-rank test.
A: The cluster of differentiation 147 expression, survival time and survival status, and the cluster of differentiation 147 expression heatmap of The Cancer Genome Atlas dataset; B: The high-expression groups demonstrated poor prognosis and hazard ratio > 1 (log-rank P = 0.000542, HR: 1.856, 95%CI: 1.308 to 2.636); C: Based on the area under the curve values obtained from receiver operating characteristic curves, the 1-year, 3-year, and 5-year survival rates were 0.675 (95%CI: 0.611 to 0.740), 0.623 (95%CI: 0.555 to 0.692), and 0.664 (95%CI: 0.582 to 9.745).
- Citation: Xu YJ, He HJ, Wu P, Li WB. Expression patterns of cluster of differentiation 147 impact the prognosis of hepatocellular carcinoma. World J Gastrointest Oncol 2023; 15(8): 1412-1423
- URL: https://www.wjgnet.com/1948-5204/full/v15/i8/1412.htm
- DOI: https://dx.doi.org/10.4251/wjgo.v15.i8.1412


