Copyright
©The Author(s) 2023.
World J Gastrointest Oncol. Aug 15, 2023; 15(8): 1349-1365
Published online Aug 15, 2023. doi: 10.4251/wjgo.v15.i8.1349
Published online Aug 15, 2023. doi: 10.4251/wjgo.v15.i8.1349
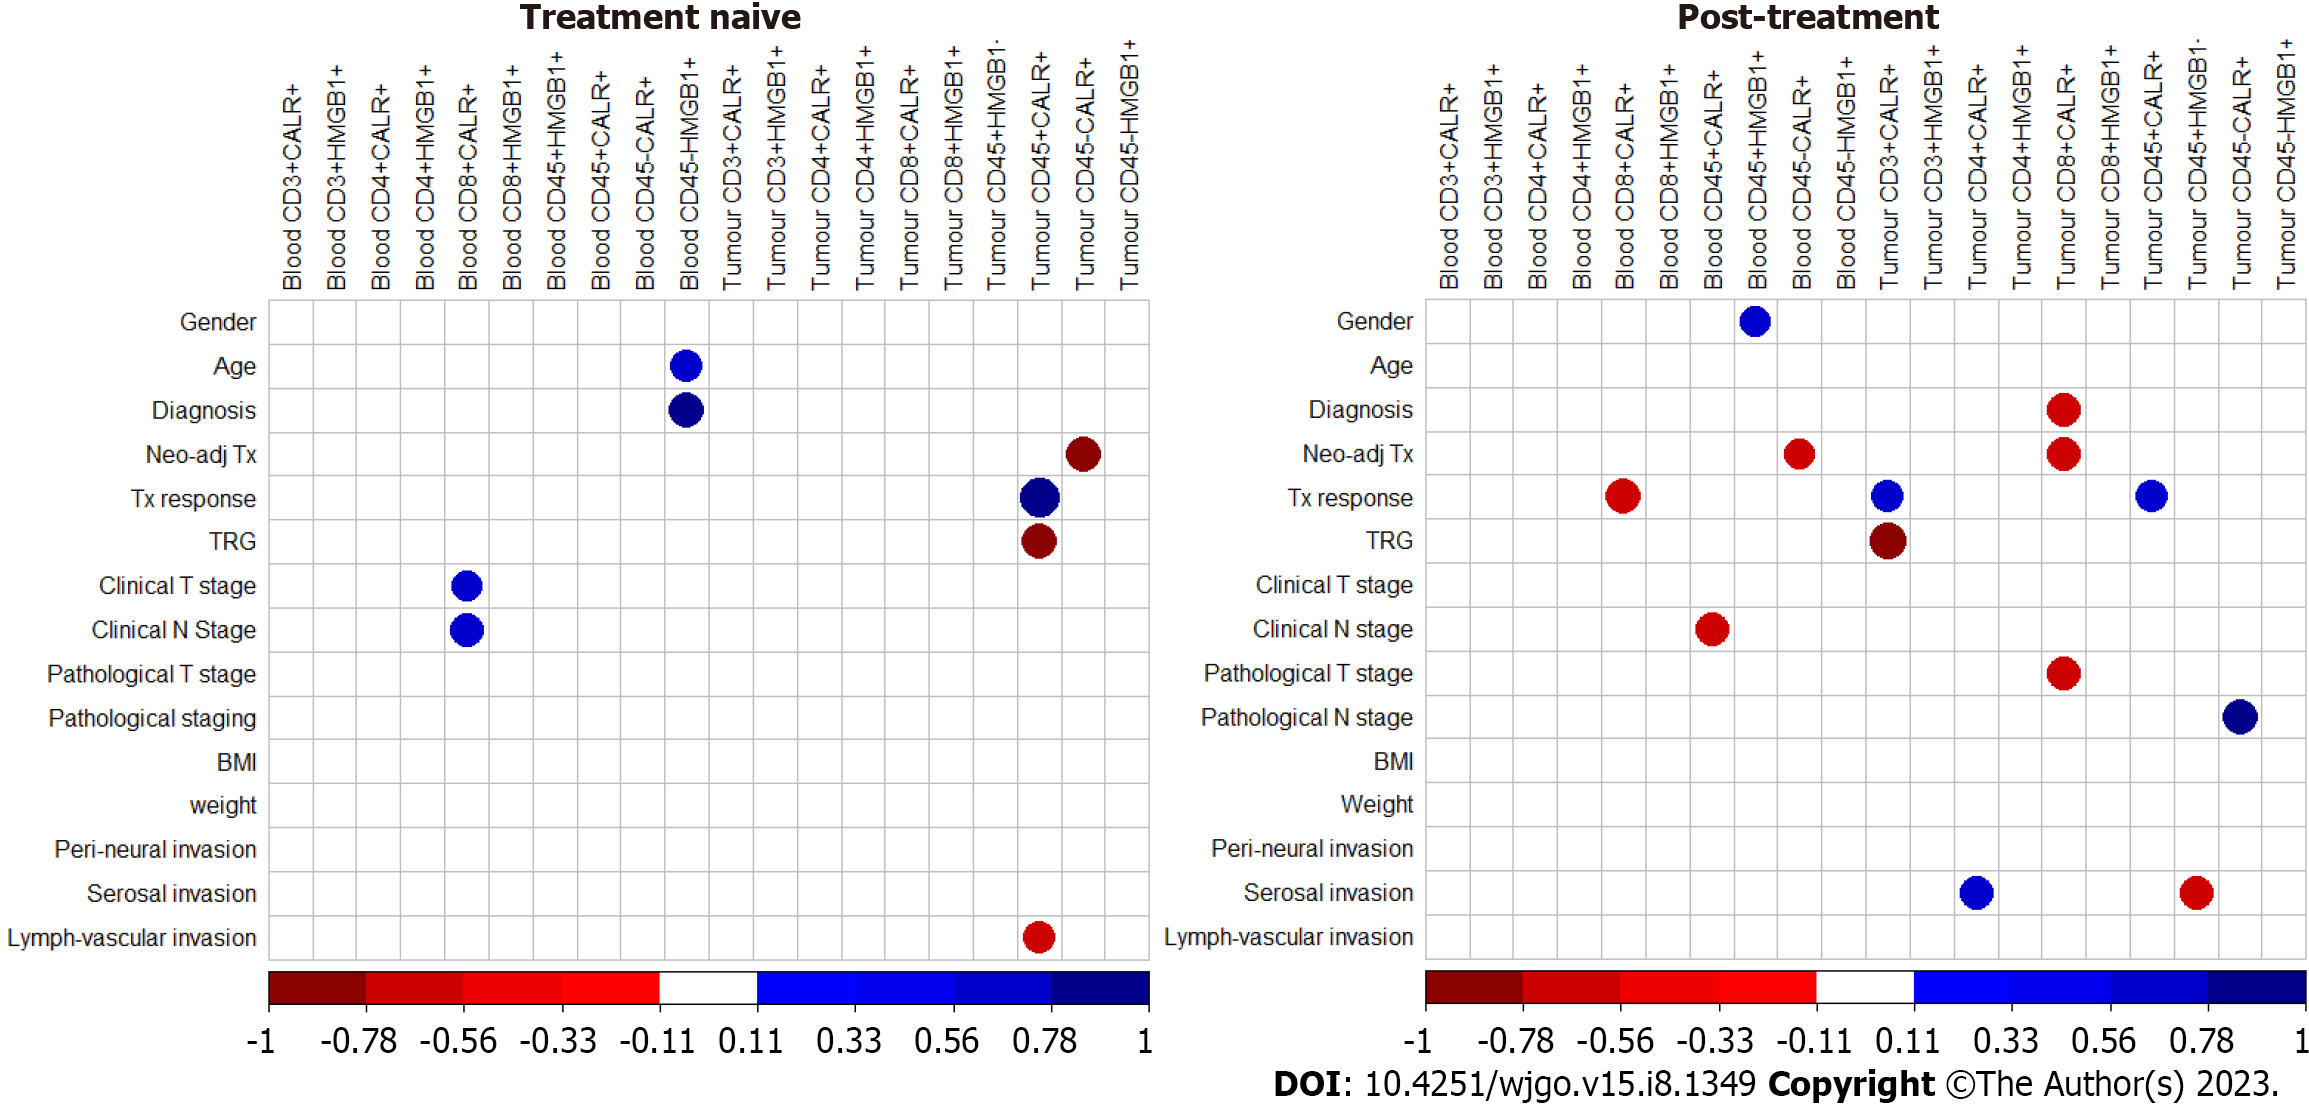
Figure 7 Corrplots illustrating the correlation values for the expression and co-expression of damage associated molecular patterns in oesophageal adenocarcinoma blood and tumour pre and post treatment, correlated with clinical demographics and characteristics.
Patient clinical features included age, weight (pre-treatment, kg), BMI (pre-treatment, kg/m2), neo-adjuvant treatment received, treatment response (determined by radiographic features using PET/CT), tumour regression grade (TRG), clinical tumour stage and nodal involvement, pathological tumour stage and nodal involvement, BMI (post-treatment, kg/m2), weight (post-treatment, kg), serosal invasion and lymph-vascular invasion. Blue indicates a positive correlation, red negative correlation. Spearman correlation. Significant data shown only. Spearman r 0.4-0.59 moderate, 0.6-0.79 strong and 0.8-1 very strong. aP < 0.05.
- Citation: Donlon NE, Davern M, Sheppard A, O'Connell F, Moran B, Nugent TS, Heeran A, Phelan JJ, Bhardwaj A, Butler C, Ravi N, Donohoe CL, Lynam-Lennon N, Maher S, Reynolds JV, Lysaght J. Potential of damage associated molecular patterns in synergising radiation and the immune response in oesophageal cancer. World J Gastrointest Oncol 2023; 15(8): 1349-1365
- URL: https://www.wjgnet.com/1948-5204/full/v15/i8/1349.htm
- DOI: https://dx.doi.org/10.4251/wjgo.v15.i8.1349


