Copyright
©The Author(s) 2023.
World J Gastrointest Oncol. Aug 15, 2023; 15(8): 1349-1365
Published online Aug 15, 2023. doi: 10.4251/wjgo.v15.i8.1349
Published online Aug 15, 2023. doi: 10.4251/wjgo.v15.i8.1349
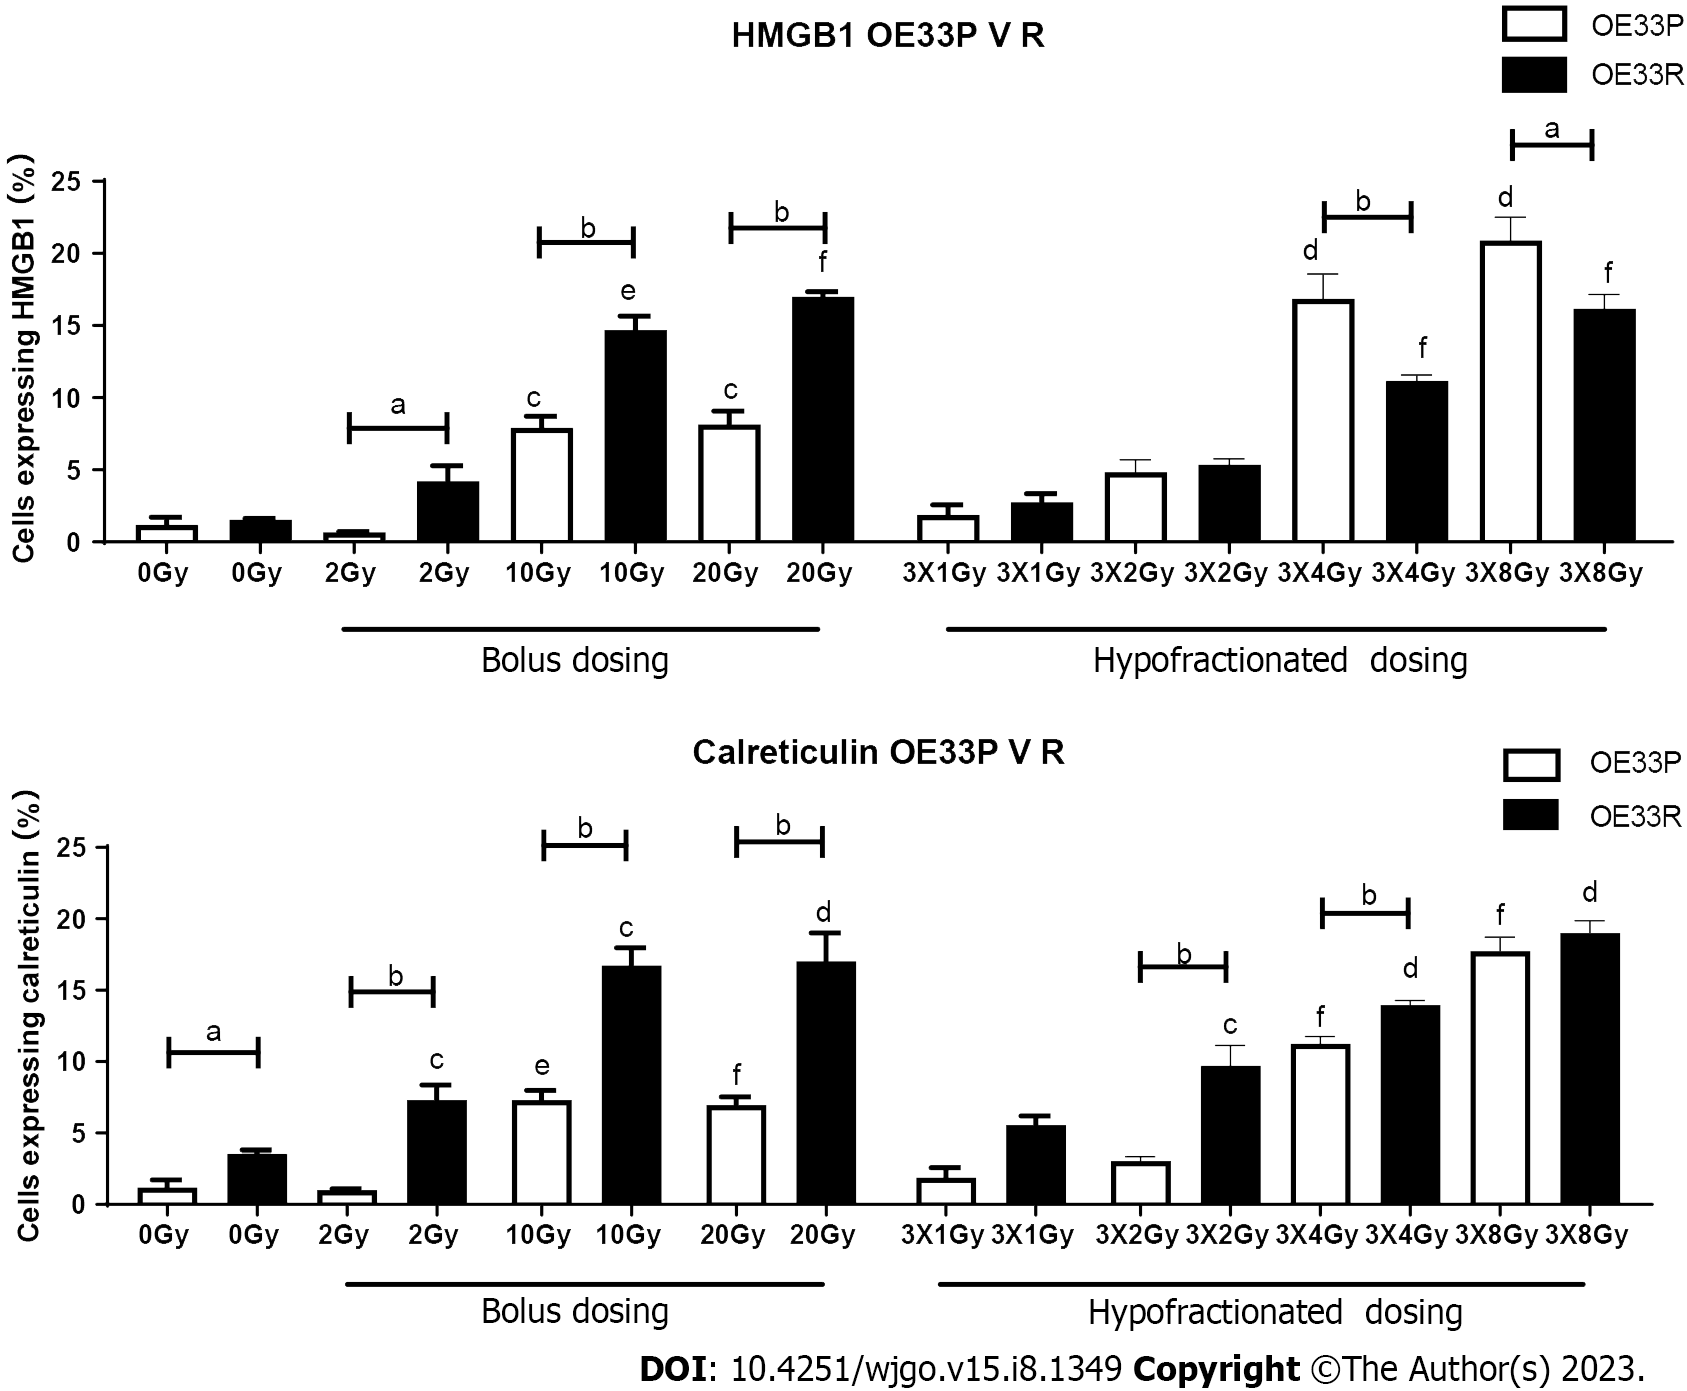
Figure 1 HMGB1 and calreticulin are expressed at a higher level on the OE33R cell line compared to the OE33P cell line with bolus dosing and at higher levels on the OE33P cell line with fractionated dosing.
OE33P & OE33R cell lines were screened for the surface expression of HMGB1 and calreticulin by flow cytometry. Tukey’s multiple comparison testing. Graph shows % expression (± SEM) (n = 3). aP < 0.05, bP < 0.01 vs OE33P and OE33R; cP < 0.01, dP < 0.001 vs dosing with 0 Gy on OE33P; eP < 0.01, fP < 0.001 vs dosing with 0 Gy on OE33R.
- Citation: Donlon NE, Davern M, Sheppard A, O'Connell F, Moran B, Nugent TS, Heeran A, Phelan JJ, Bhardwaj A, Butler C, Ravi N, Donohoe CL, Lynam-Lennon N, Maher S, Reynolds JV, Lysaght J. Potential of damage associated molecular patterns in synergising radiation and the immune response in oesophageal cancer. World J Gastrointest Oncol 2023; 15(8): 1349-1365
- URL: https://www.wjgnet.com/1948-5204/full/v15/i8/1349.htm
- DOI: https://dx.doi.org/10.4251/wjgo.v15.i8.1349


