Copyright
©The Author(s) 2023.
World J Gastrointest Oncol. Jun 15, 2023; 15(6): 1051-1061
Published online Jun 15, 2023. doi: 10.4251/wjgo.v15.i6.1051
Published online Jun 15, 2023. doi: 10.4251/wjgo.v15.i6.1051
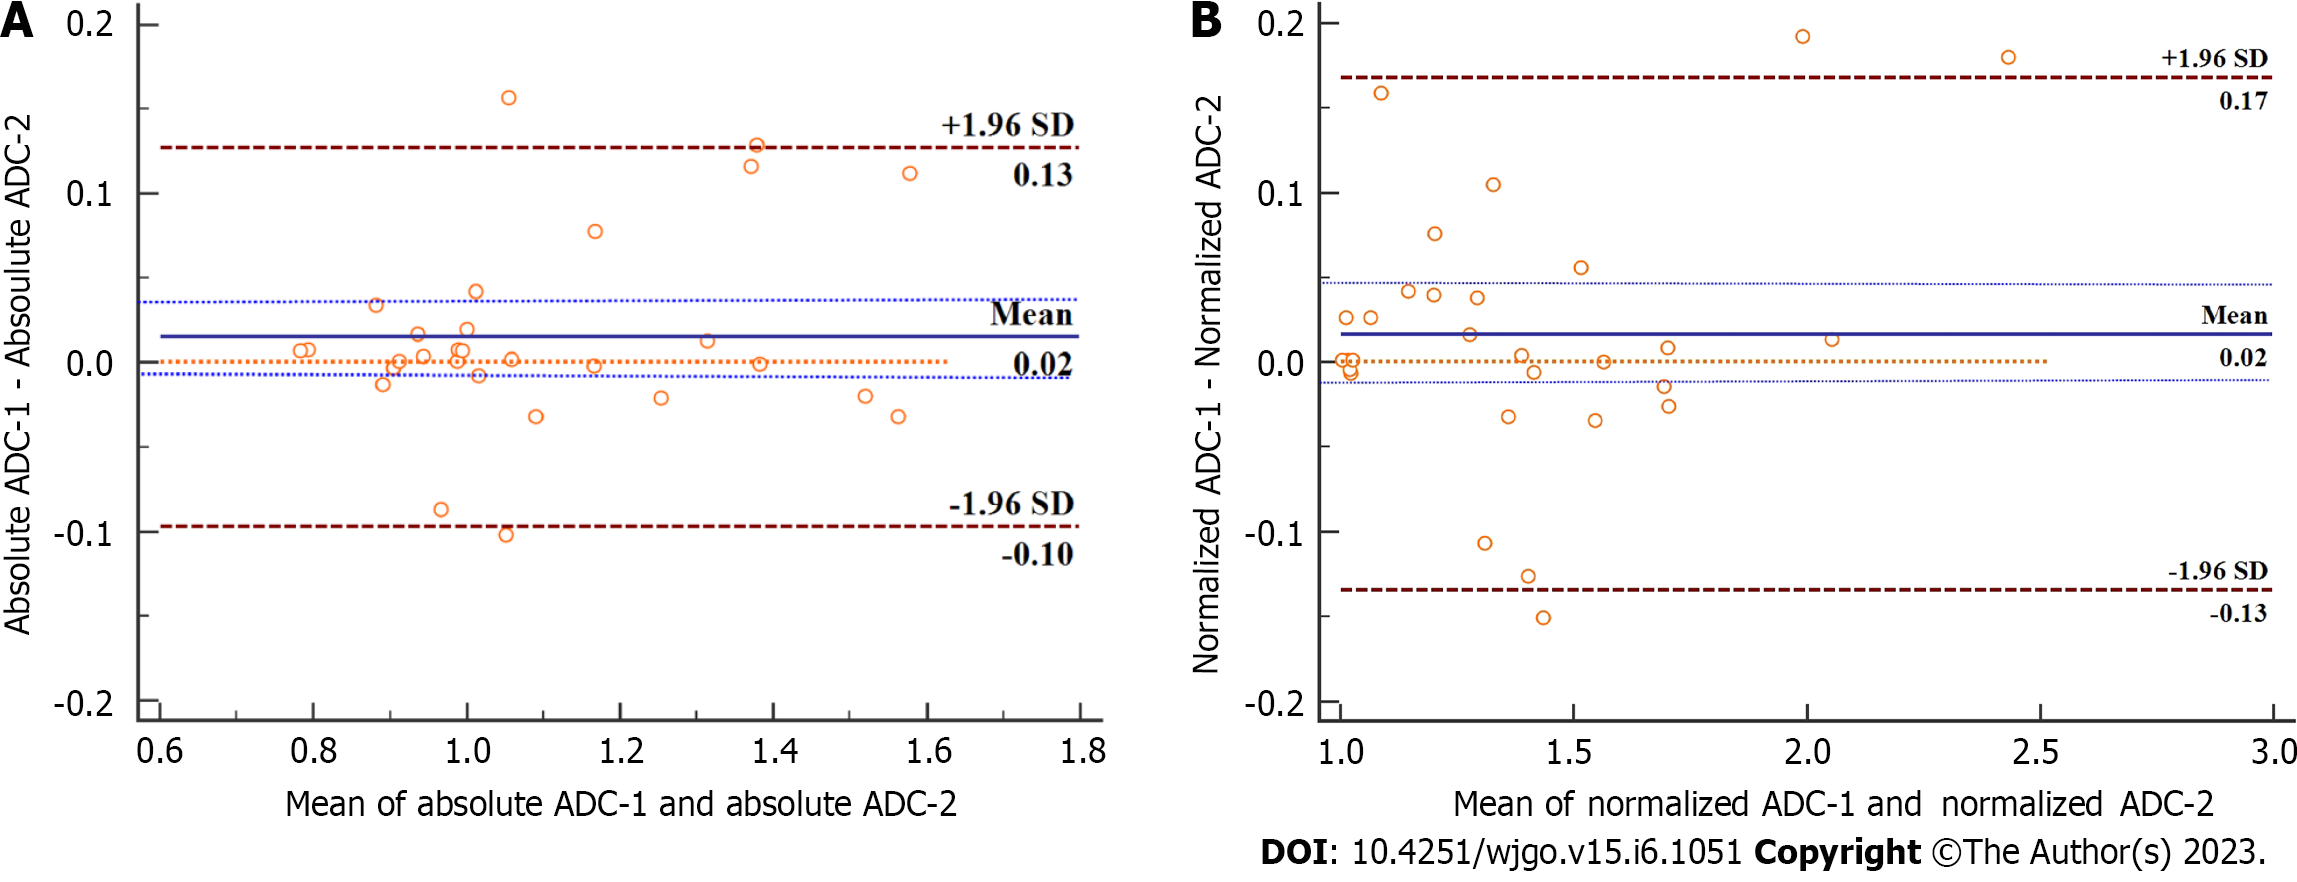
Figure 4 Bland-Altman plots of absolute apparent diffusion coefficient and normalized apparent diffusion coefficient for the two readers’ measurements with the representation of the 95% limits of agreement (dotted and dashed brown lines).
A: Absolute apparent diffusion coefficient (ADC); B: Normalized ADC. For both absolute ADC and normalized ADC values, the bias between two readers (solid blue line) was not significant, with the line of equality (dotted orange line) falling within the 95% confidence interval of the mean difference (dashed blue lines). SD: Standard deviation.
- Citation: Ren S, Guo K, Li Y, Cao YY, Wang ZQ, Tian Y. Diagnostic accuracy of apparent diffusion coefficient to differentiate intrapancreatic accessory spleen from pancreatic neuroendocrine tumors. World J Gastrointest Oncol 2023; 15(6): 1051-1061
- URL: https://www.wjgnet.com/1948-5204/full/v15/i6/1051.htm
- DOI: https://dx.doi.org/10.4251/wjgo.v15.i6.1051


