Copyright
©The Author(s) 2023.
World J Gastrointest Oncol. Jun 15, 2023; 15(6): 1051-1061
Published online Jun 15, 2023. doi: 10.4251/wjgo.v15.i6.1051
Published online Jun 15, 2023. doi: 10.4251/wjgo.v15.i6.1051
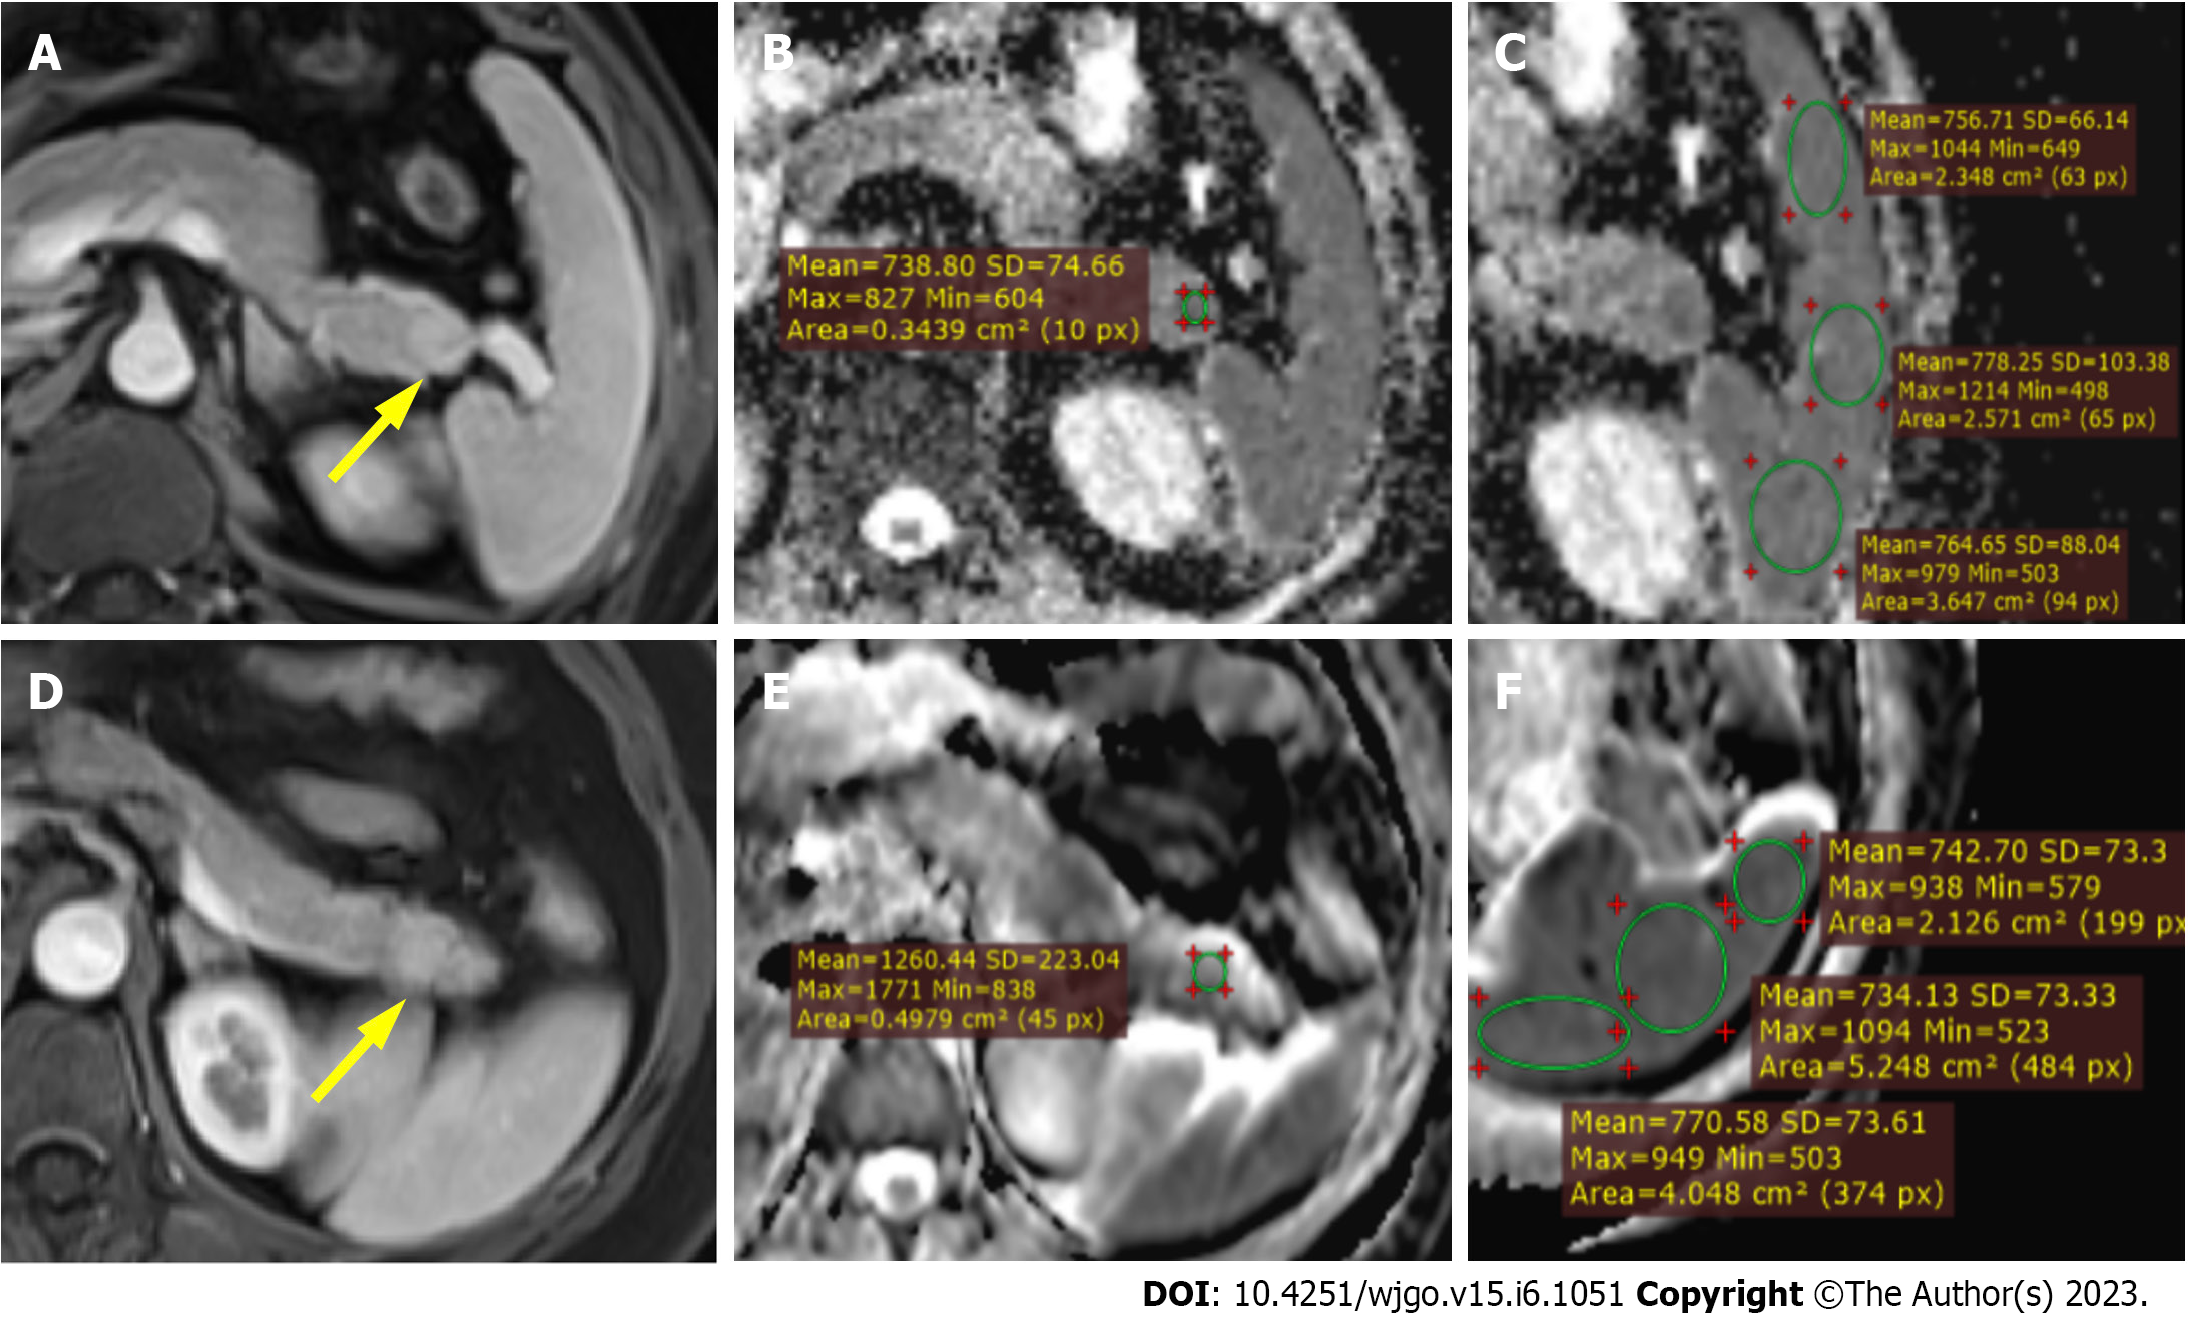
Figure 2 Magnetic resonance images.
A-C: Magnetic resonance images in a 51-year-old male with pathologically proven intrapancreatic accessory spleen. The lesion was located at the tail of the pancreas with a hypervascular enhancement pattern on contrast-enhanced arterial phase T1 weighted imaging (T1WI) (yellow arrow, A). After confirming the lesion on arterial phase T1WI and diffusion-weighted imaging (B), circular regions of interest (ROI) were placed within the lesion on the apparent diffusion coefficient (ADC) map (B) and showed an ADC value of 0.738 × 10⁻³ mm2/s. Similarly, ADC measurement was carried out on the adjacent spleen using circular ROIs (C) and demonstrated an average splenic ADC of 0.767 × 10⁻³ mm2/s. The normalized ADC (lesion-to-spleen ADC ratio) was 0.962; D-F: Magnetic resonance images in a 45-year-old female with pathologically proven G2 pancreatic neuroendocrine tumor. The lesion was located at the tail of the pancreas with a hypervascular enhancement pattern on contrast-enhanced arterial phase T1WI (yellow arrow, D). After confirming the lesion on arterial phase T1WI and diffusion-weighted imaging (B), circular ROI was placed within the lesion on the ADC map (B) and showed an ADC value of 1.260 × 10⁻³ mm2/s. Similarly, ADC measurement was carried out on the adjacent spleen using circular ROIs (C) and demonstrated an average splenic ADC of 0.749 × 10⁻³ mm2/s. The normalized ADC (lesion-to-spleen ADC ratio) was 1.682.
- Citation: Ren S, Guo K, Li Y, Cao YY, Wang ZQ, Tian Y. Diagnostic accuracy of apparent diffusion coefficient to differentiate intrapancreatic accessory spleen from pancreatic neuroendocrine tumors. World J Gastrointest Oncol 2023; 15(6): 1051-1061
- URL: https://www.wjgnet.com/1948-5204/full/v15/i6/1051.htm
- DOI: https://dx.doi.org/10.4251/wjgo.v15.i6.1051


