Copyright
©The Author(s) 2023.
World J Gastrointest Oncol. Jun 15, 2023; 15(6): 1005-1018
Published online Jun 15, 2023. doi: 10.4251/wjgo.v15.i6.1005
Published online Jun 15, 2023. doi: 10.4251/wjgo.v15.i6.1005
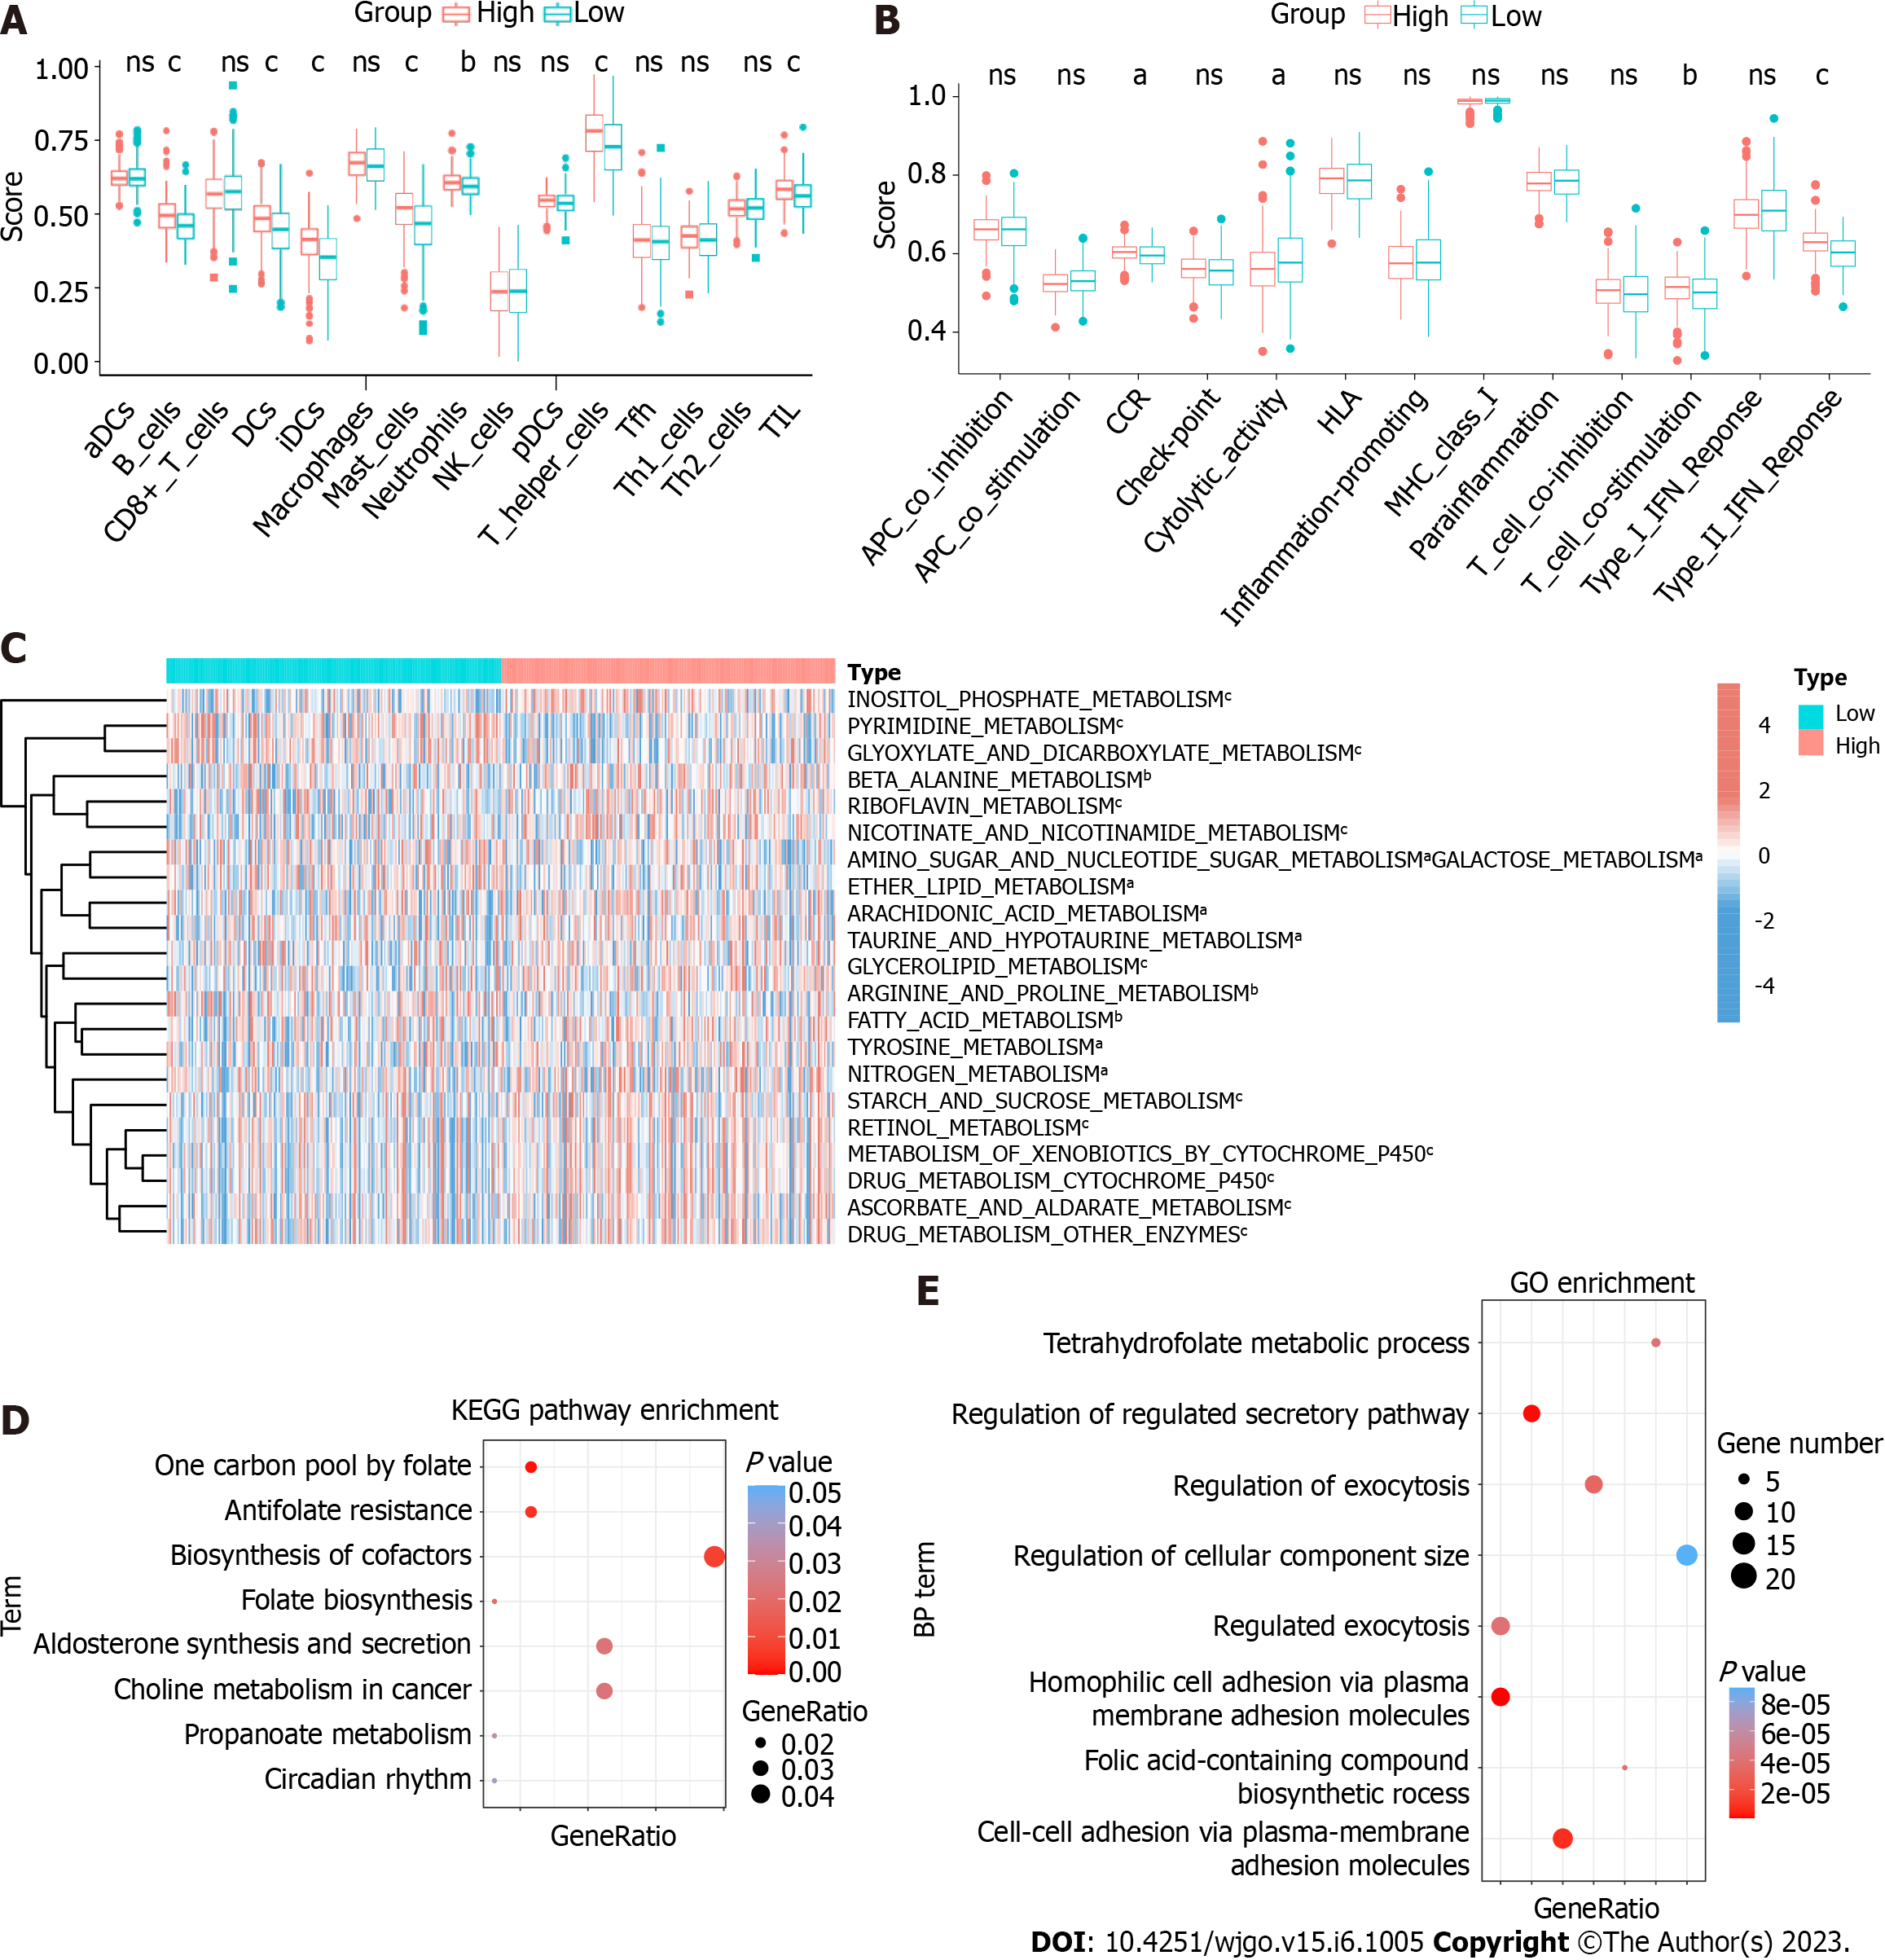
Figure 6 HPSE2-associated immune and metabolic profiles in colorectal cancer.
A and B: Scores of immune cells and immune functions by ssGSEA in the colorectal cancer (CRC) patients of HPSE2-low and HPSE2-high groups. C: Unsupervised clustering of metabolic pathways in CRC patients of HPSE2-low and HPSE2-high groups by ssGSEA. D: Kyoto Encyclopedia of Genes and Genome pathway analysis and gene ontology enrichment analysis; E: For 5′transfer RNA halves-Pro-TGG predicted genes. The vertical axis shows the annotated functions of the predicted genes. The horizontal axis shows the ratio of different genes in the specific pathway/progress and P value (showed by colors) of each cluster, respectively. aP < 0.05, bP < 0.01, cP < 0.001. ns: Not significant; CRC: Colorectal cancer; KEGG: Kyoto Encyclopedia of Genes and Genome; BP: Biological process; GO: Gene ontology; HLA: Human leukocyte antigen; IFN: Interferon.
- Citation: Wang XY, Zhou YJ, Chen HY, Chen JN, Chen SS, Chen HM, Li XB. 5’tiRNA-Pro-TGG, a novel tRNA halve, promotes oncogenesis in sessile serrated lesions and serrated pathway of colorectal cancer. World J Gastrointest Oncol 2023; 15(6): 1005-1018
- URL: https://www.wjgnet.com/1948-5204/full/v15/i6/1005.htm
- DOI: https://dx.doi.org/10.4251/wjgo.v15.i6.1005


