Copyright
©The Author(s) 2023.
World J Gastrointest Oncol. Jun 15, 2023; 15(6): 1005-1018
Published online Jun 15, 2023. doi: 10.4251/wjgo.v15.i6.1005
Published online Jun 15, 2023. doi: 10.4251/wjgo.v15.i6.1005
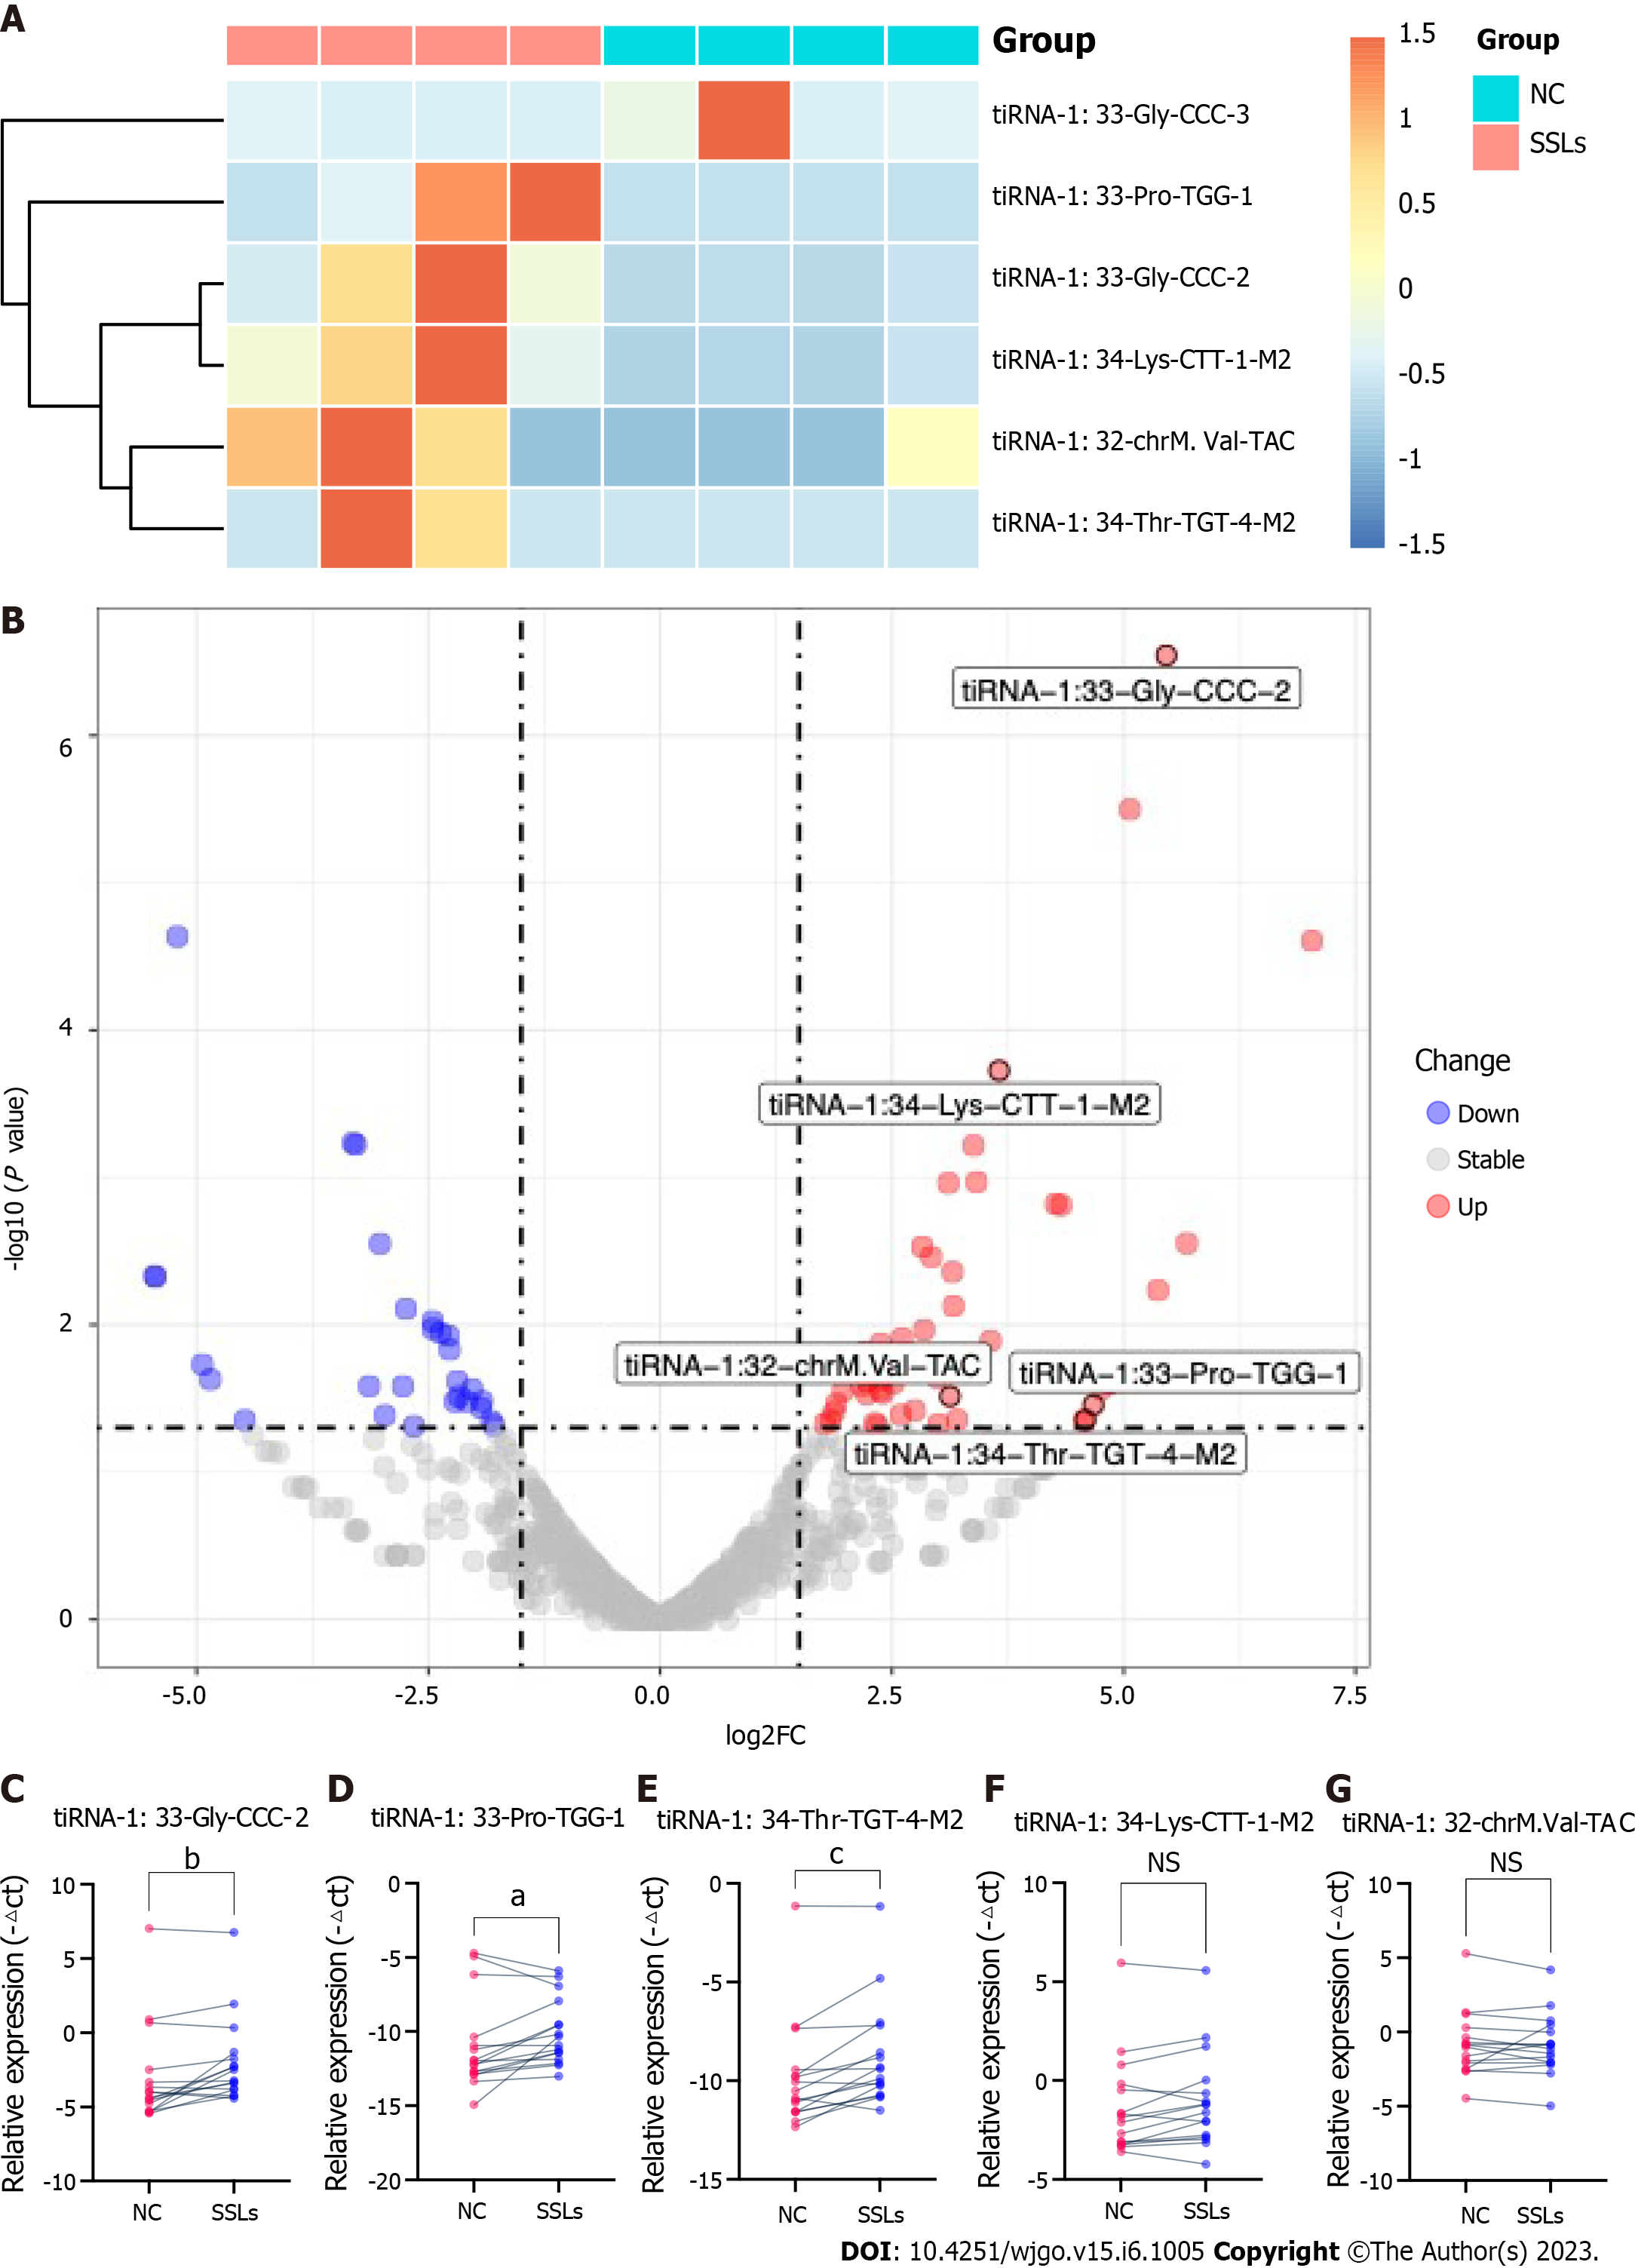
Figure 3 Validation for the discrepant expression levels of 5′transfer RNA halves.
A: Heatmap of the expression levels of six differently expressed 5′transfer RNA halves (tiRNAs) in sessile serrated lesions (SSLs) vs normal control (NC). B: Volcano chart of transfer RNA-related fragments (tRFs) and tiRNAs. Red/blue circles indicate statistically significant differentially expressed tRFs and tiRNAs with the absolute log2 (fold change) of no < 1.5 and a P value ≤ 0.05 (red: Upregulated; blue: Downregulated). Gray circles indicate nondifferentially expressed tRFs and tiRNAs, with fold changes and/or P values not meeting the cutoff thresholds. C-G: qRT-polymerase chain reaction for the validation of five upregulated 5′tiRNAs in 16 paired SSLs and NC tissues. All data were analyzed using paired Student′s t-test. The asterisk indicates a significant difference between the two groups (aP < 0.05, bP < 0.01, cP < 0.001). NS: Not significant; SSLs: Sessile serrated lesions; NC: Normal control; tRF: Transfer RNA-related fragment; tiRNA: Transfer RNA halves.
- Citation: Wang XY, Zhou YJ, Chen HY, Chen JN, Chen SS, Chen HM, Li XB. 5’tiRNA-Pro-TGG, a novel tRNA halve, promotes oncogenesis in sessile serrated lesions and serrated pathway of colorectal cancer. World J Gastrointest Oncol 2023; 15(6): 1005-1018
- URL: https://www.wjgnet.com/1948-5204/full/v15/i6/1005.htm
- DOI: https://dx.doi.org/10.4251/wjgo.v15.i6.1005


