Copyright
©The Author(s) 2023.
World J Gastrointest Oncol. Jun 15, 2023; 15(6): 1005-1018
Published online Jun 15, 2023. doi: 10.4251/wjgo.v15.i6.1005
Published online Jun 15, 2023. doi: 10.4251/wjgo.v15.i6.1005
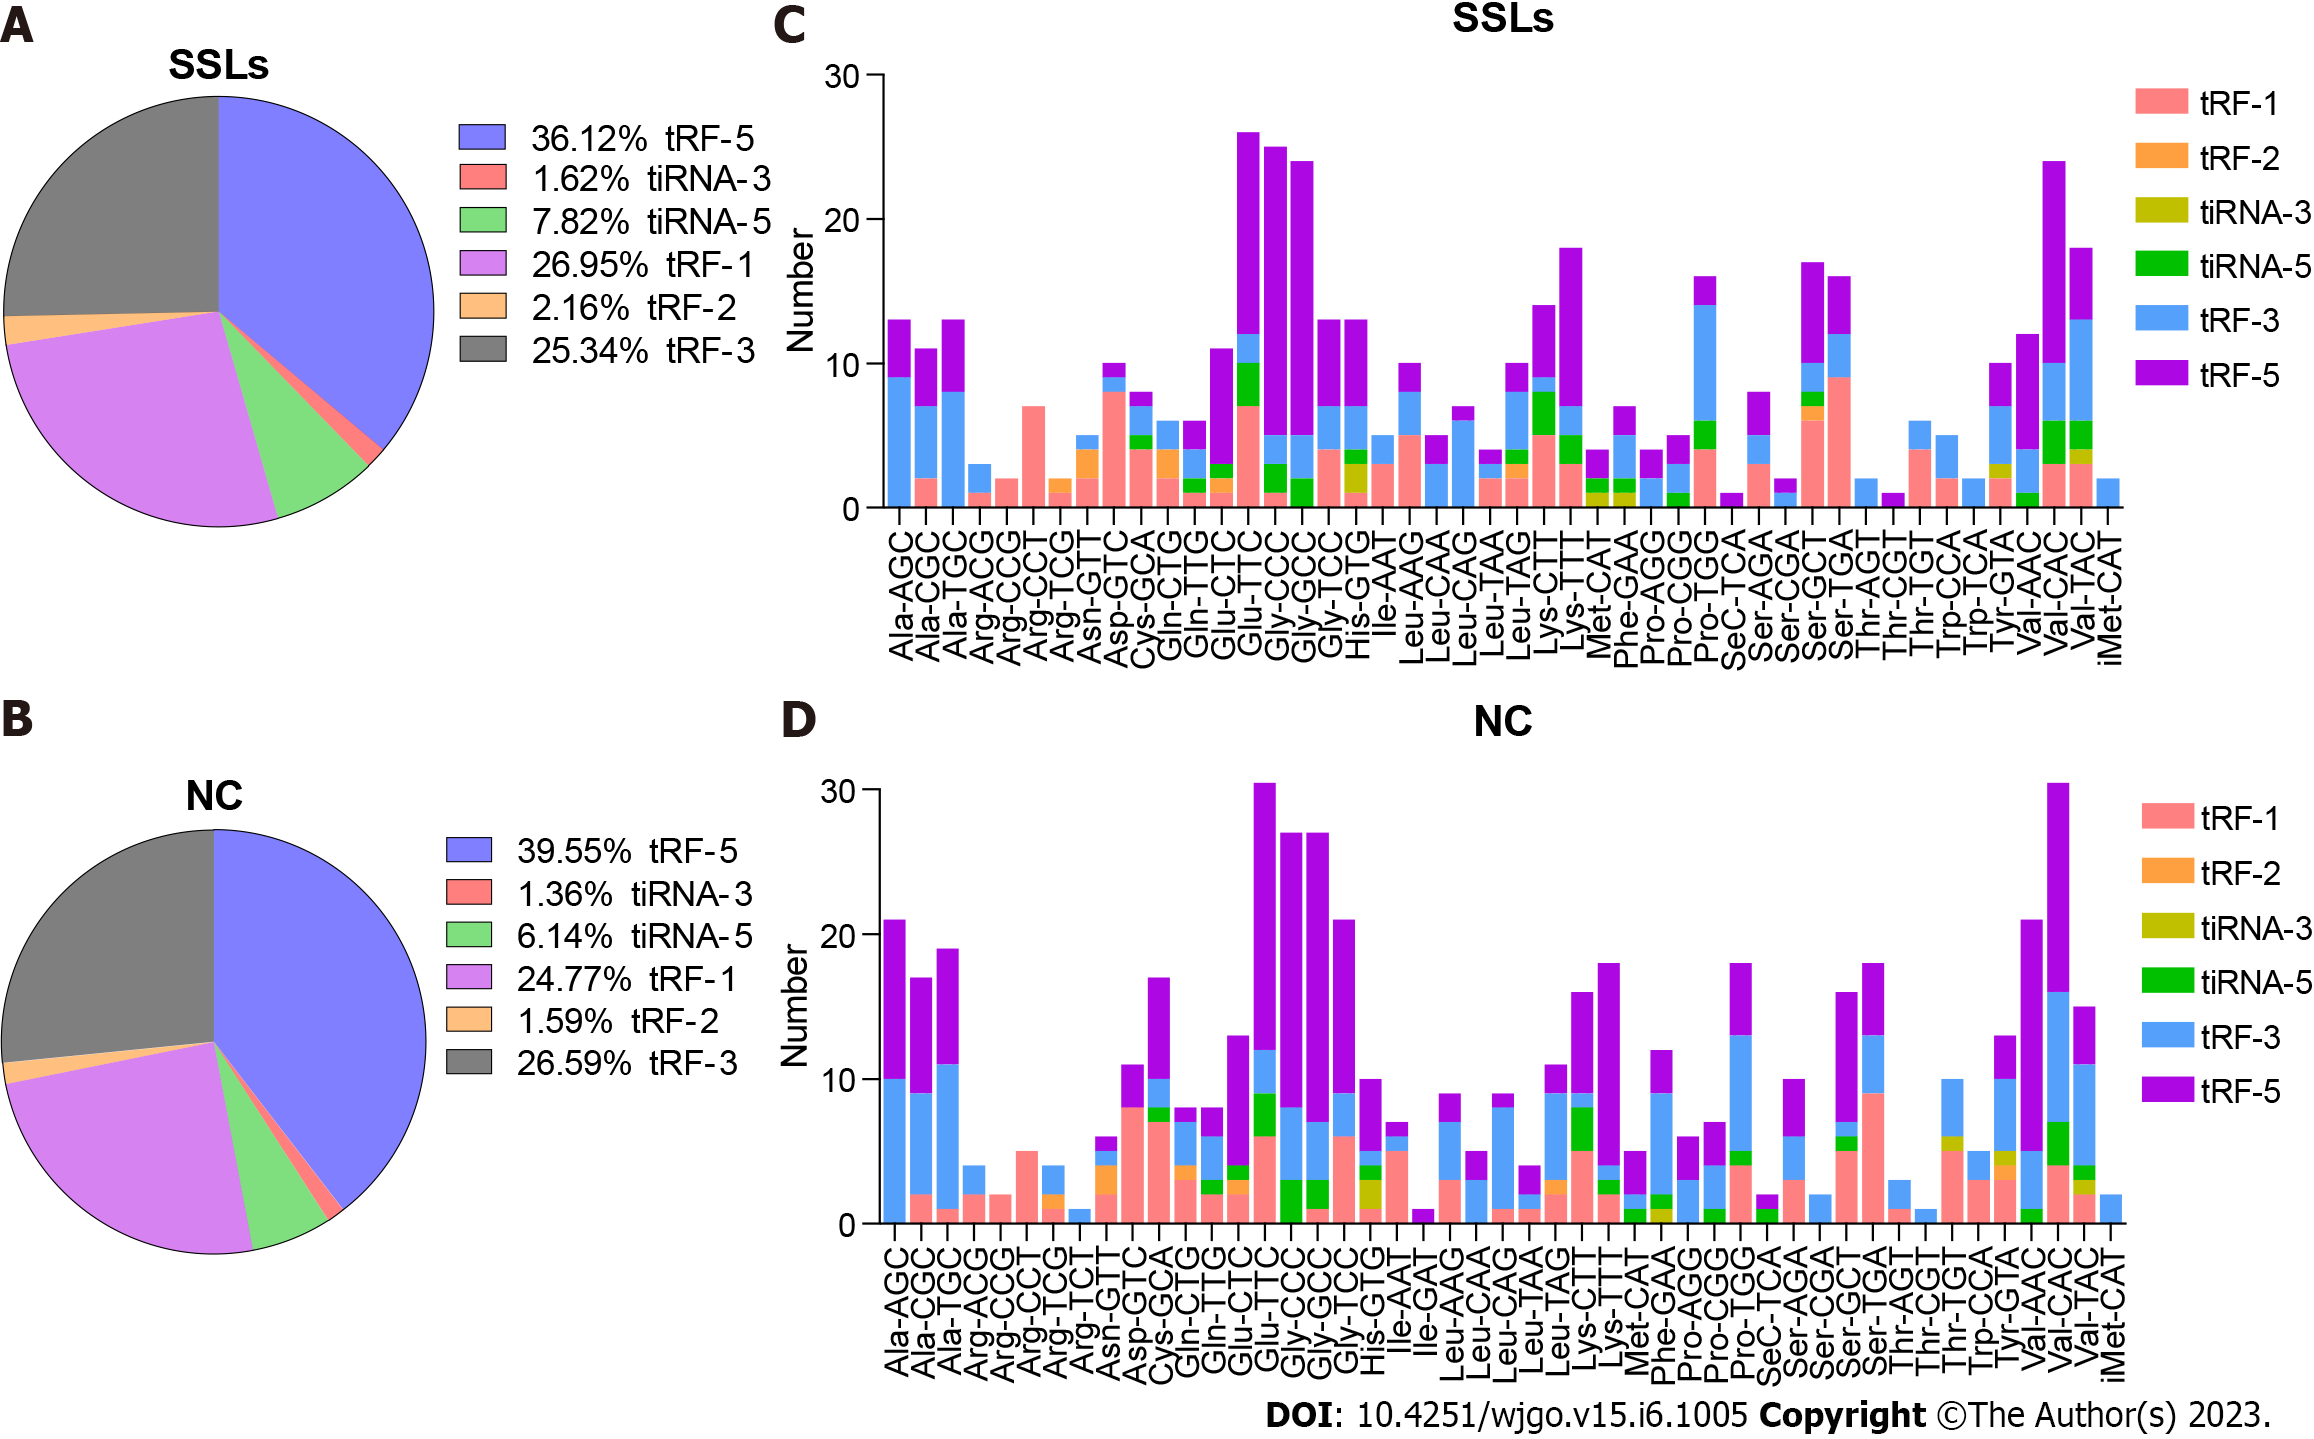
Figure 2 Distribution of transfer RNA-related fragment and transfer RNA halves subtypes in sessile serrated lesions and normal control groups.
A and B: Pie charts for all kinds of subtype of transfer RNA-related fragment (tRFs) and transfer RNA halves (tiRNAs) in the two separated groups. The values in the pie chart are ratios of each subtype of tRFs and tiRNAs in sessile serrated lesions (SSLs) and normal control (NC), respectively. C and D: Stacked plot for all subtypes of tRFs and tiRNAs of each group clustered based on the anticodons of tRNAs. The X-axis represents tRNAs with the same anticodon and the Y-axis shows the number of all subtype tRFs and tiRNAs derived from the same anticodon tRNA. The color bar represents the number of each subtype tRFs and tiRNAs. SSLs: Sessile serrated lesions; NC: Normal control; tRF: Transfer RNA-related fragment; tiRNA: Transfer RNA halves.
- Citation: Wang XY, Zhou YJ, Chen HY, Chen JN, Chen SS, Chen HM, Li XB. 5’tiRNA-Pro-TGG, a novel tRNA halve, promotes oncogenesis in sessile serrated lesions and serrated pathway of colorectal cancer. World J Gastrointest Oncol 2023; 15(6): 1005-1018
- URL: https://www.wjgnet.com/1948-5204/full/v15/i6/1005.htm
- DOI: https://dx.doi.org/10.4251/wjgo.v15.i6.1005


