Copyright
©The Author(s) 2023.
World J Gastrointest Oncol. May 15, 2023; 15(5): 810-827
Published online May 15, 2023. doi: 10.4251/wjgo.v15.i5.810
Published online May 15, 2023. doi: 10.4251/wjgo.v15.i5.810
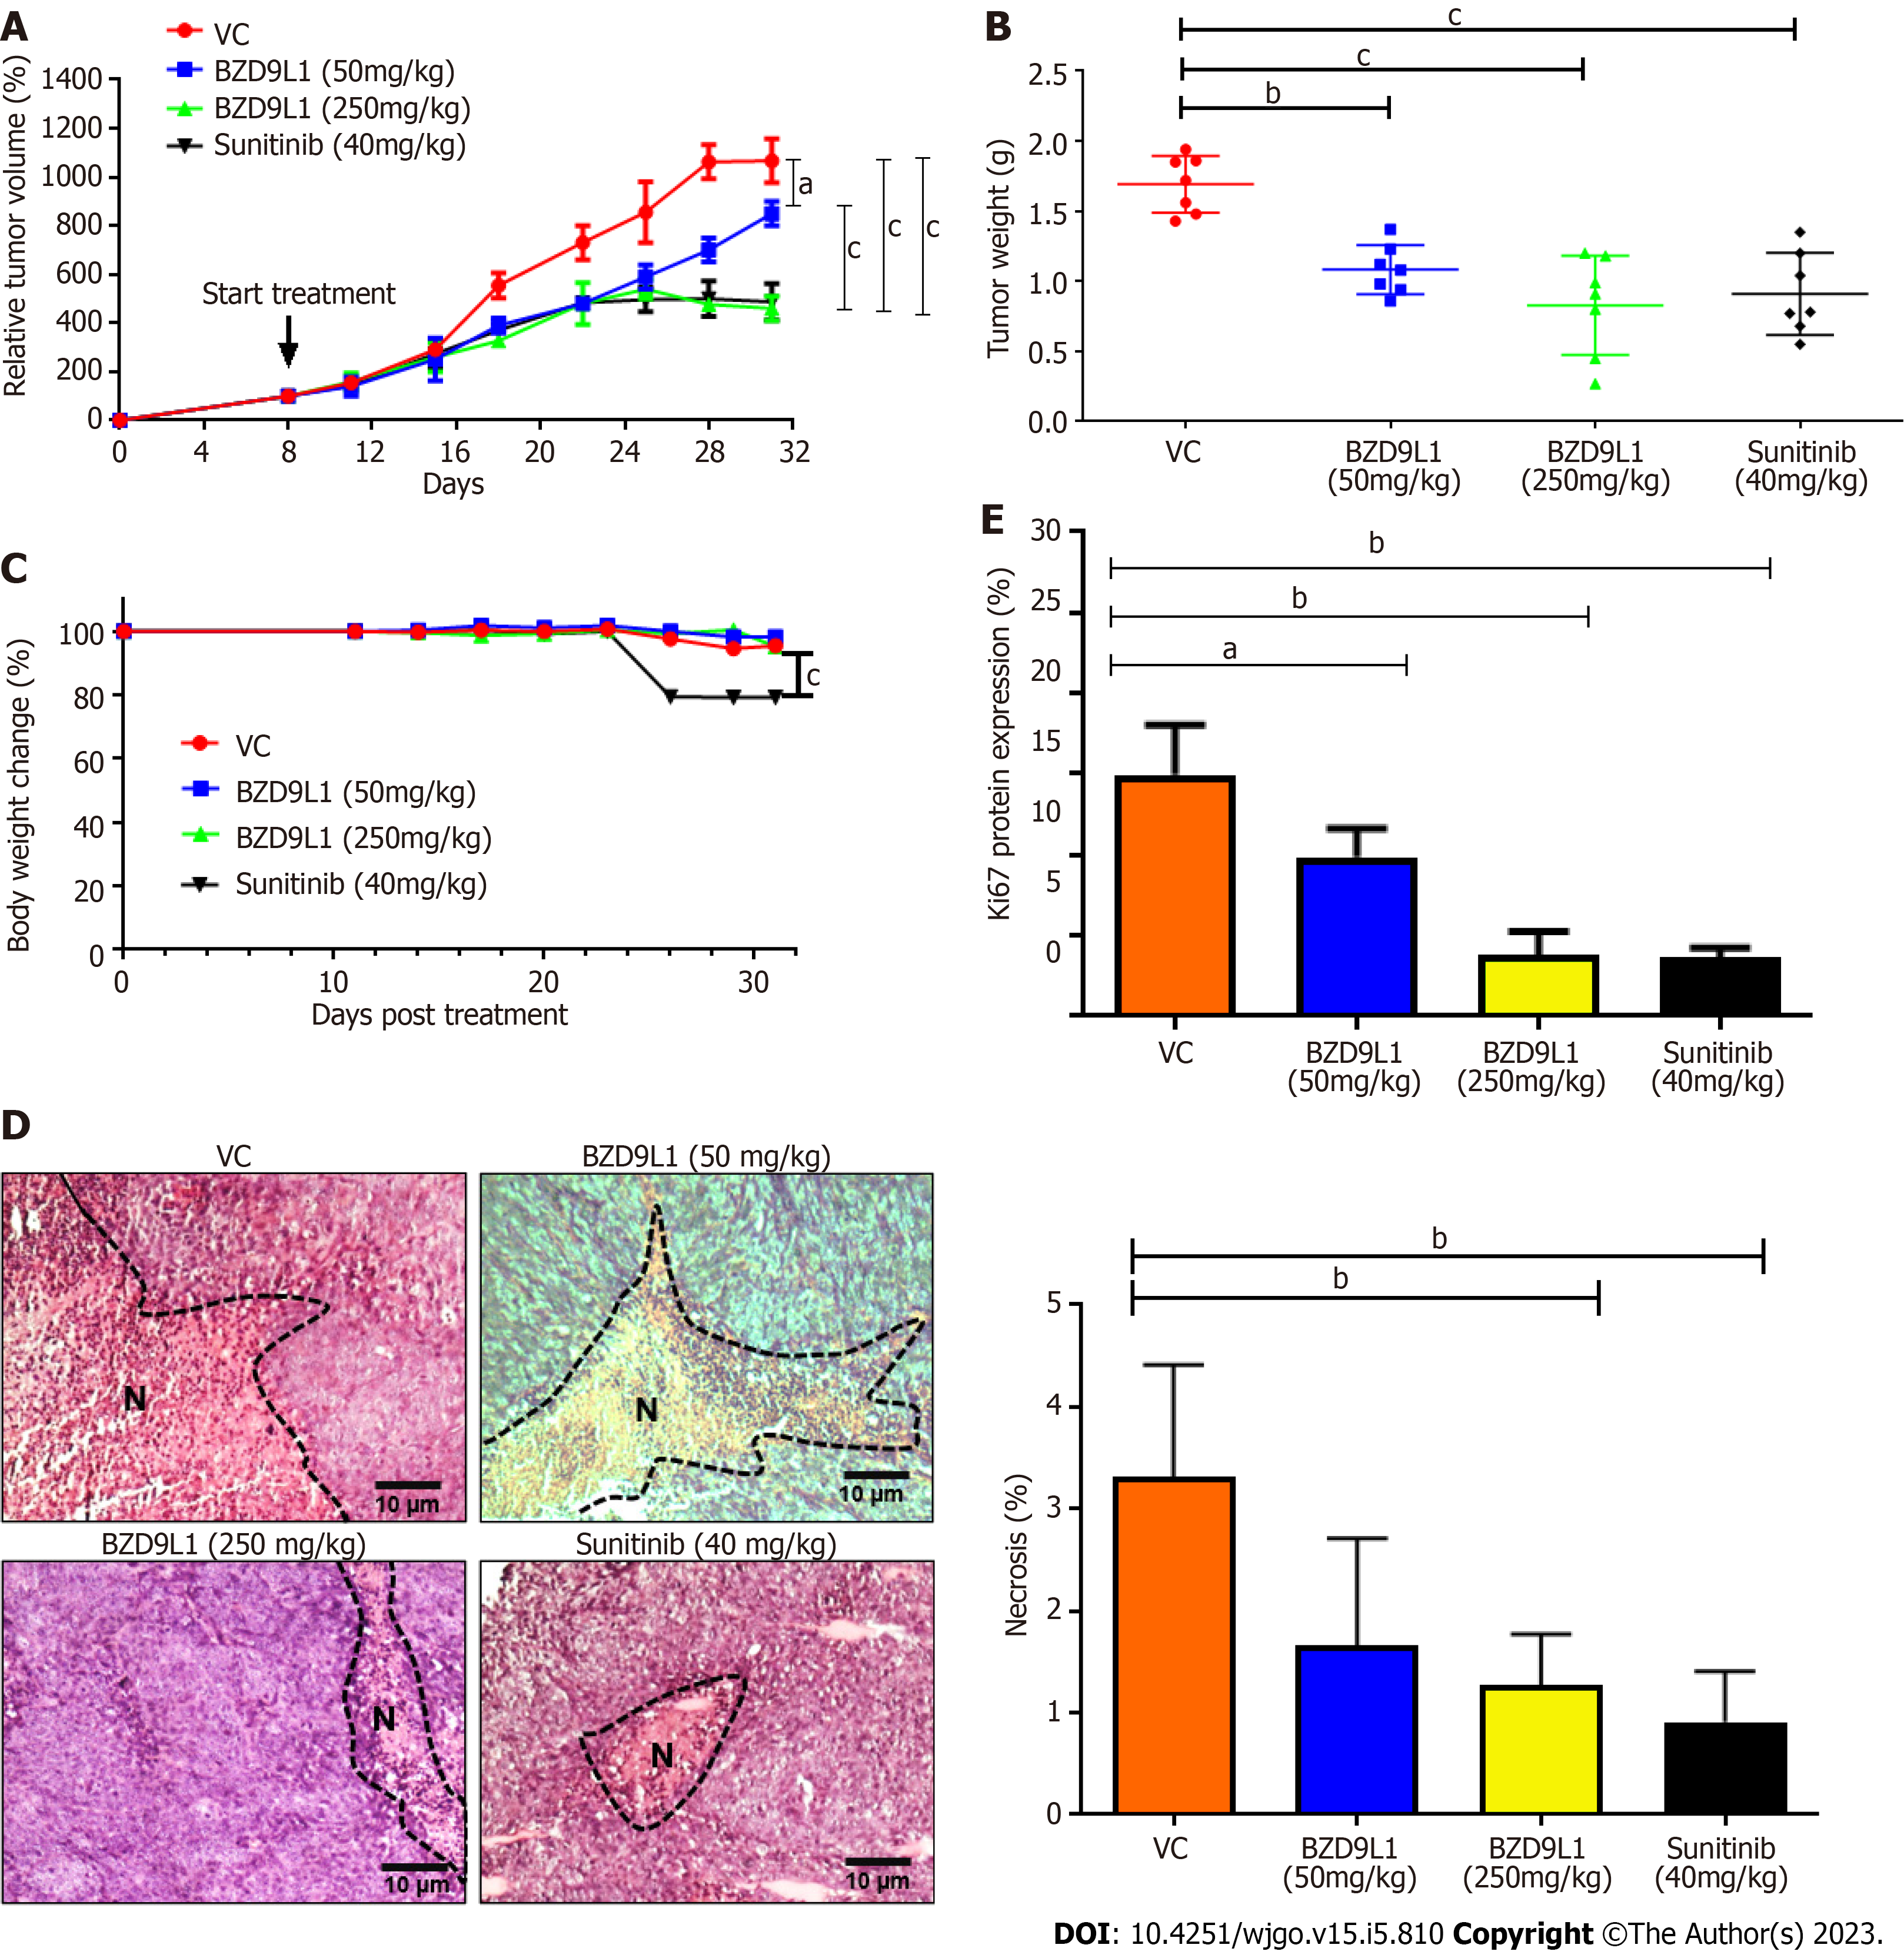
Figure 6 Tumor growth analyses of HCT116 tumor xenograft in nude mice.
Treatments were administered when the tumors reached 100 mm3. A: Relative tumor volume; B: Tumor weight and; C: Percentage body weight change in mice treated with vehicle control (0.5% carboxymethylcellulose), BZD9L1 (50 mg/kg per 3 d, BZD9L1 (250 mg/kg per 3 d) and sunitinib (40 mg/kg per 3 d) as the positive control; D: Tumor necrosis percentage in sections stained with haematoxylin and eosin. N indicates necrotic tissues; E: Ki67 proliferation protein expression in treated and vehicle control groups. Statistical analysis (aP < 0.05; bP < 0.01; cP < 0.001). The non-linear fit was used to track the tumor size and body weight change over time, one-way ANOVA with Bonferroni posthoc test for tumor weight, n = 6 animals per group) using GraphPad Prism 9.4.0. Error bars represent SEM. VC: Vehicle control.
- Citation: Oon CE, Subramaniam AV, Ooi LY, Yehya AHS, Lee YT, Kaur G, Sasidharan S, Qiu B, Wang X. BZD9L1 benzimidazole analogue hampers colorectal tumor progression by impeding angiogenesis. World J Gastrointest Oncol 2023; 15(5): 810-827
- URL: https://www.wjgnet.com/1948-5204/full/v15/i5/810.htm
- DOI: https://dx.doi.org/10.4251/wjgo.v15.i5.810


