Copyright
©The Author(s) 2023.
World J Gastrointest Oncol. Apr 15, 2023; 15(4): 689-699
Published online Apr 15, 2023. doi: 10.4251/wjgo.v15.i4.689
Published online Apr 15, 2023. doi: 10.4251/wjgo.v15.i4.689
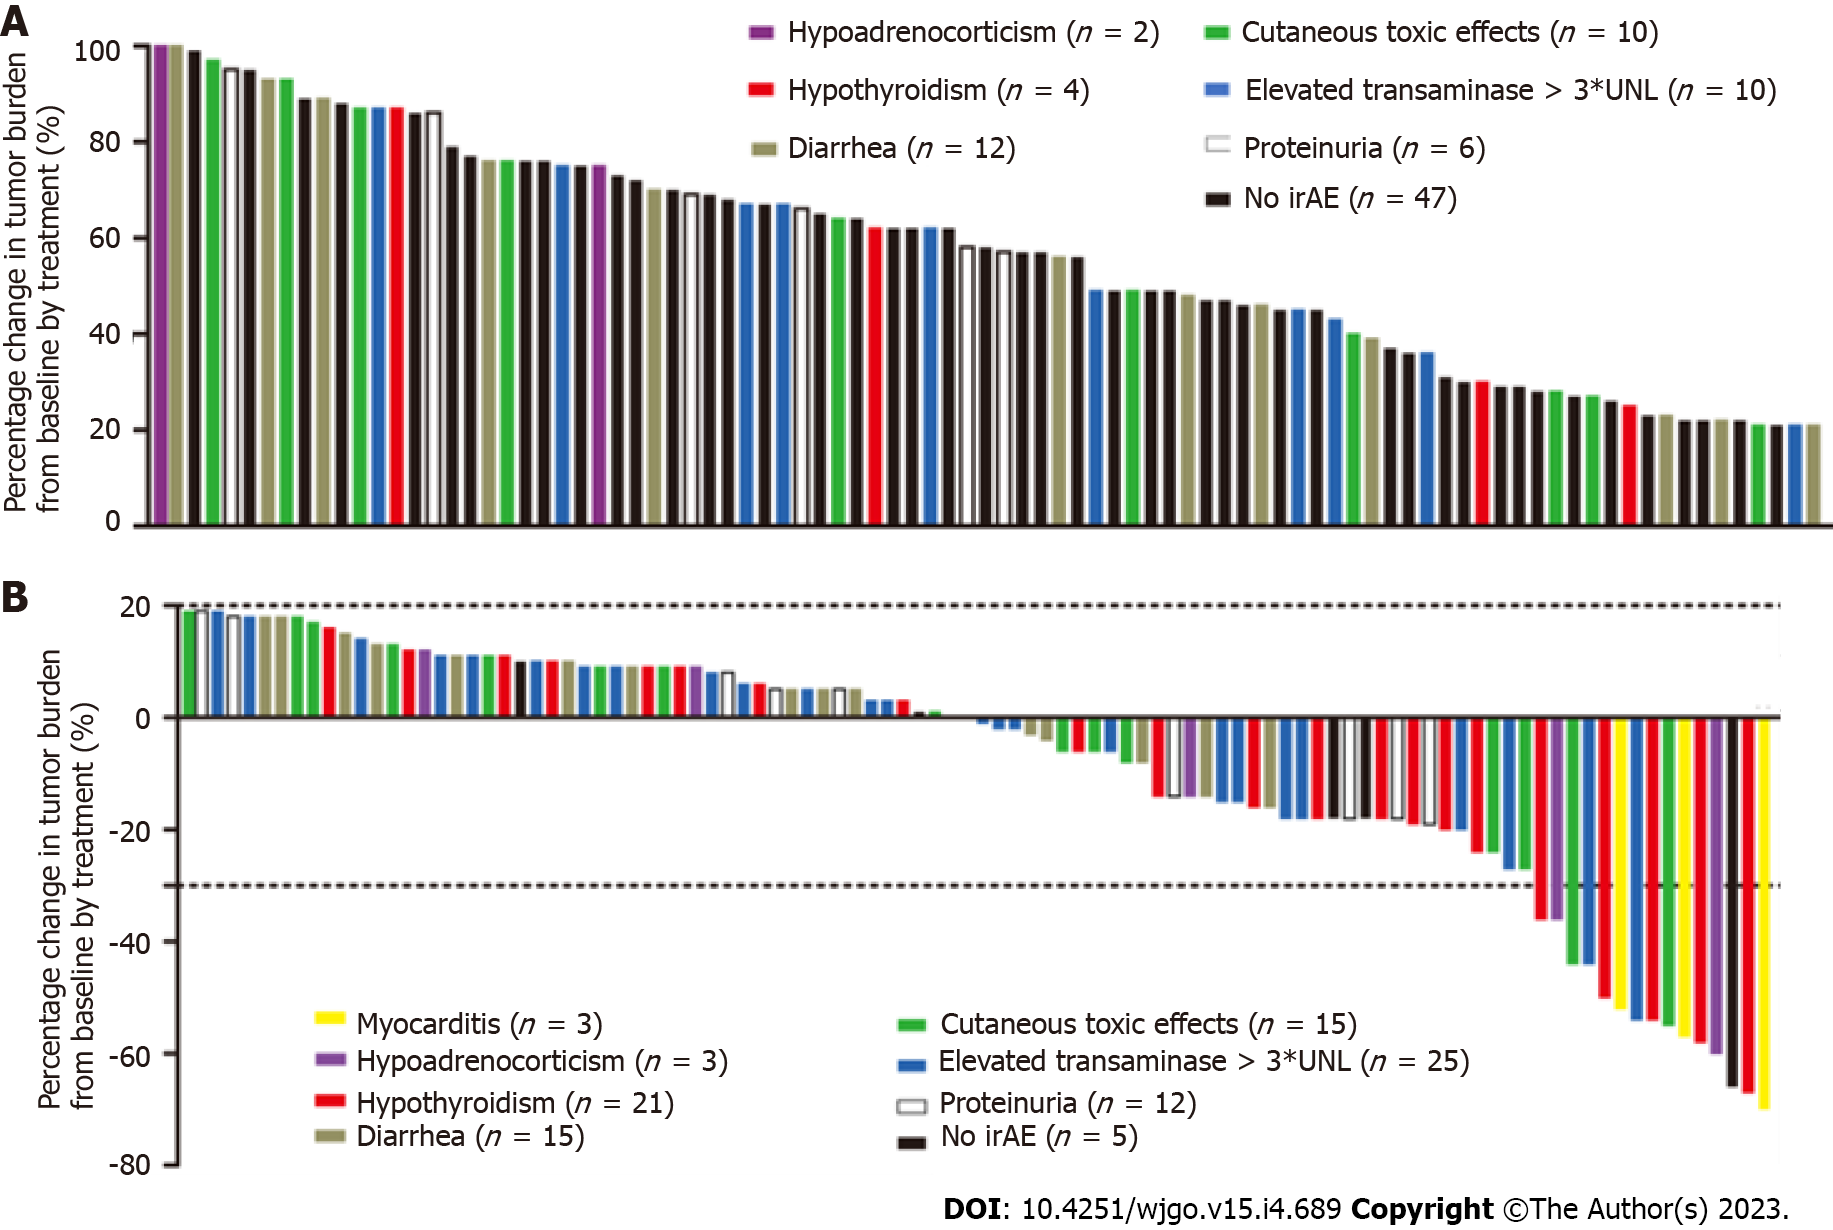
Figure 3 Waterfall plots of percentage change in tumor burden from baseline (n = 190).
The “y” axis represents the percentage change in tumor burden from baseline by treatment. The immune-related adverse events are distinguished by different colors. Negative/positive values represent maximum tumor reduction or minimum tumor increase, respectively. A: 91 patients had progressive disease; B: 99 patients achieved complete response, partial response, or stable disease. irAE: Immune-related adverse event.
- Citation: Zhou JM, Xiong HF, Chen XP, Zhang ZW, Zhu LP, Wu B. Correlation between immune-related adverse events and long-term outcomes in pembrolizumab-treated patients with unresectable hepatocellular carcinoma: A retrospective study. World J Gastrointest Oncol 2023; 15(4): 689-699
- URL: https://www.wjgnet.com/1948-5204/full/v15/i4/689.htm
- DOI: https://dx.doi.org/10.4251/wjgo.v15.i4.689


