Copyright
©The Author(s) 2023.
World J Gastrointest Oncol. Apr 15, 2023; 15(4): 644-664
Published online Apr 15, 2023. doi: 10.4251/wjgo.v15.i4.644
Published online Apr 15, 2023. doi: 10.4251/wjgo.v15.i4.644
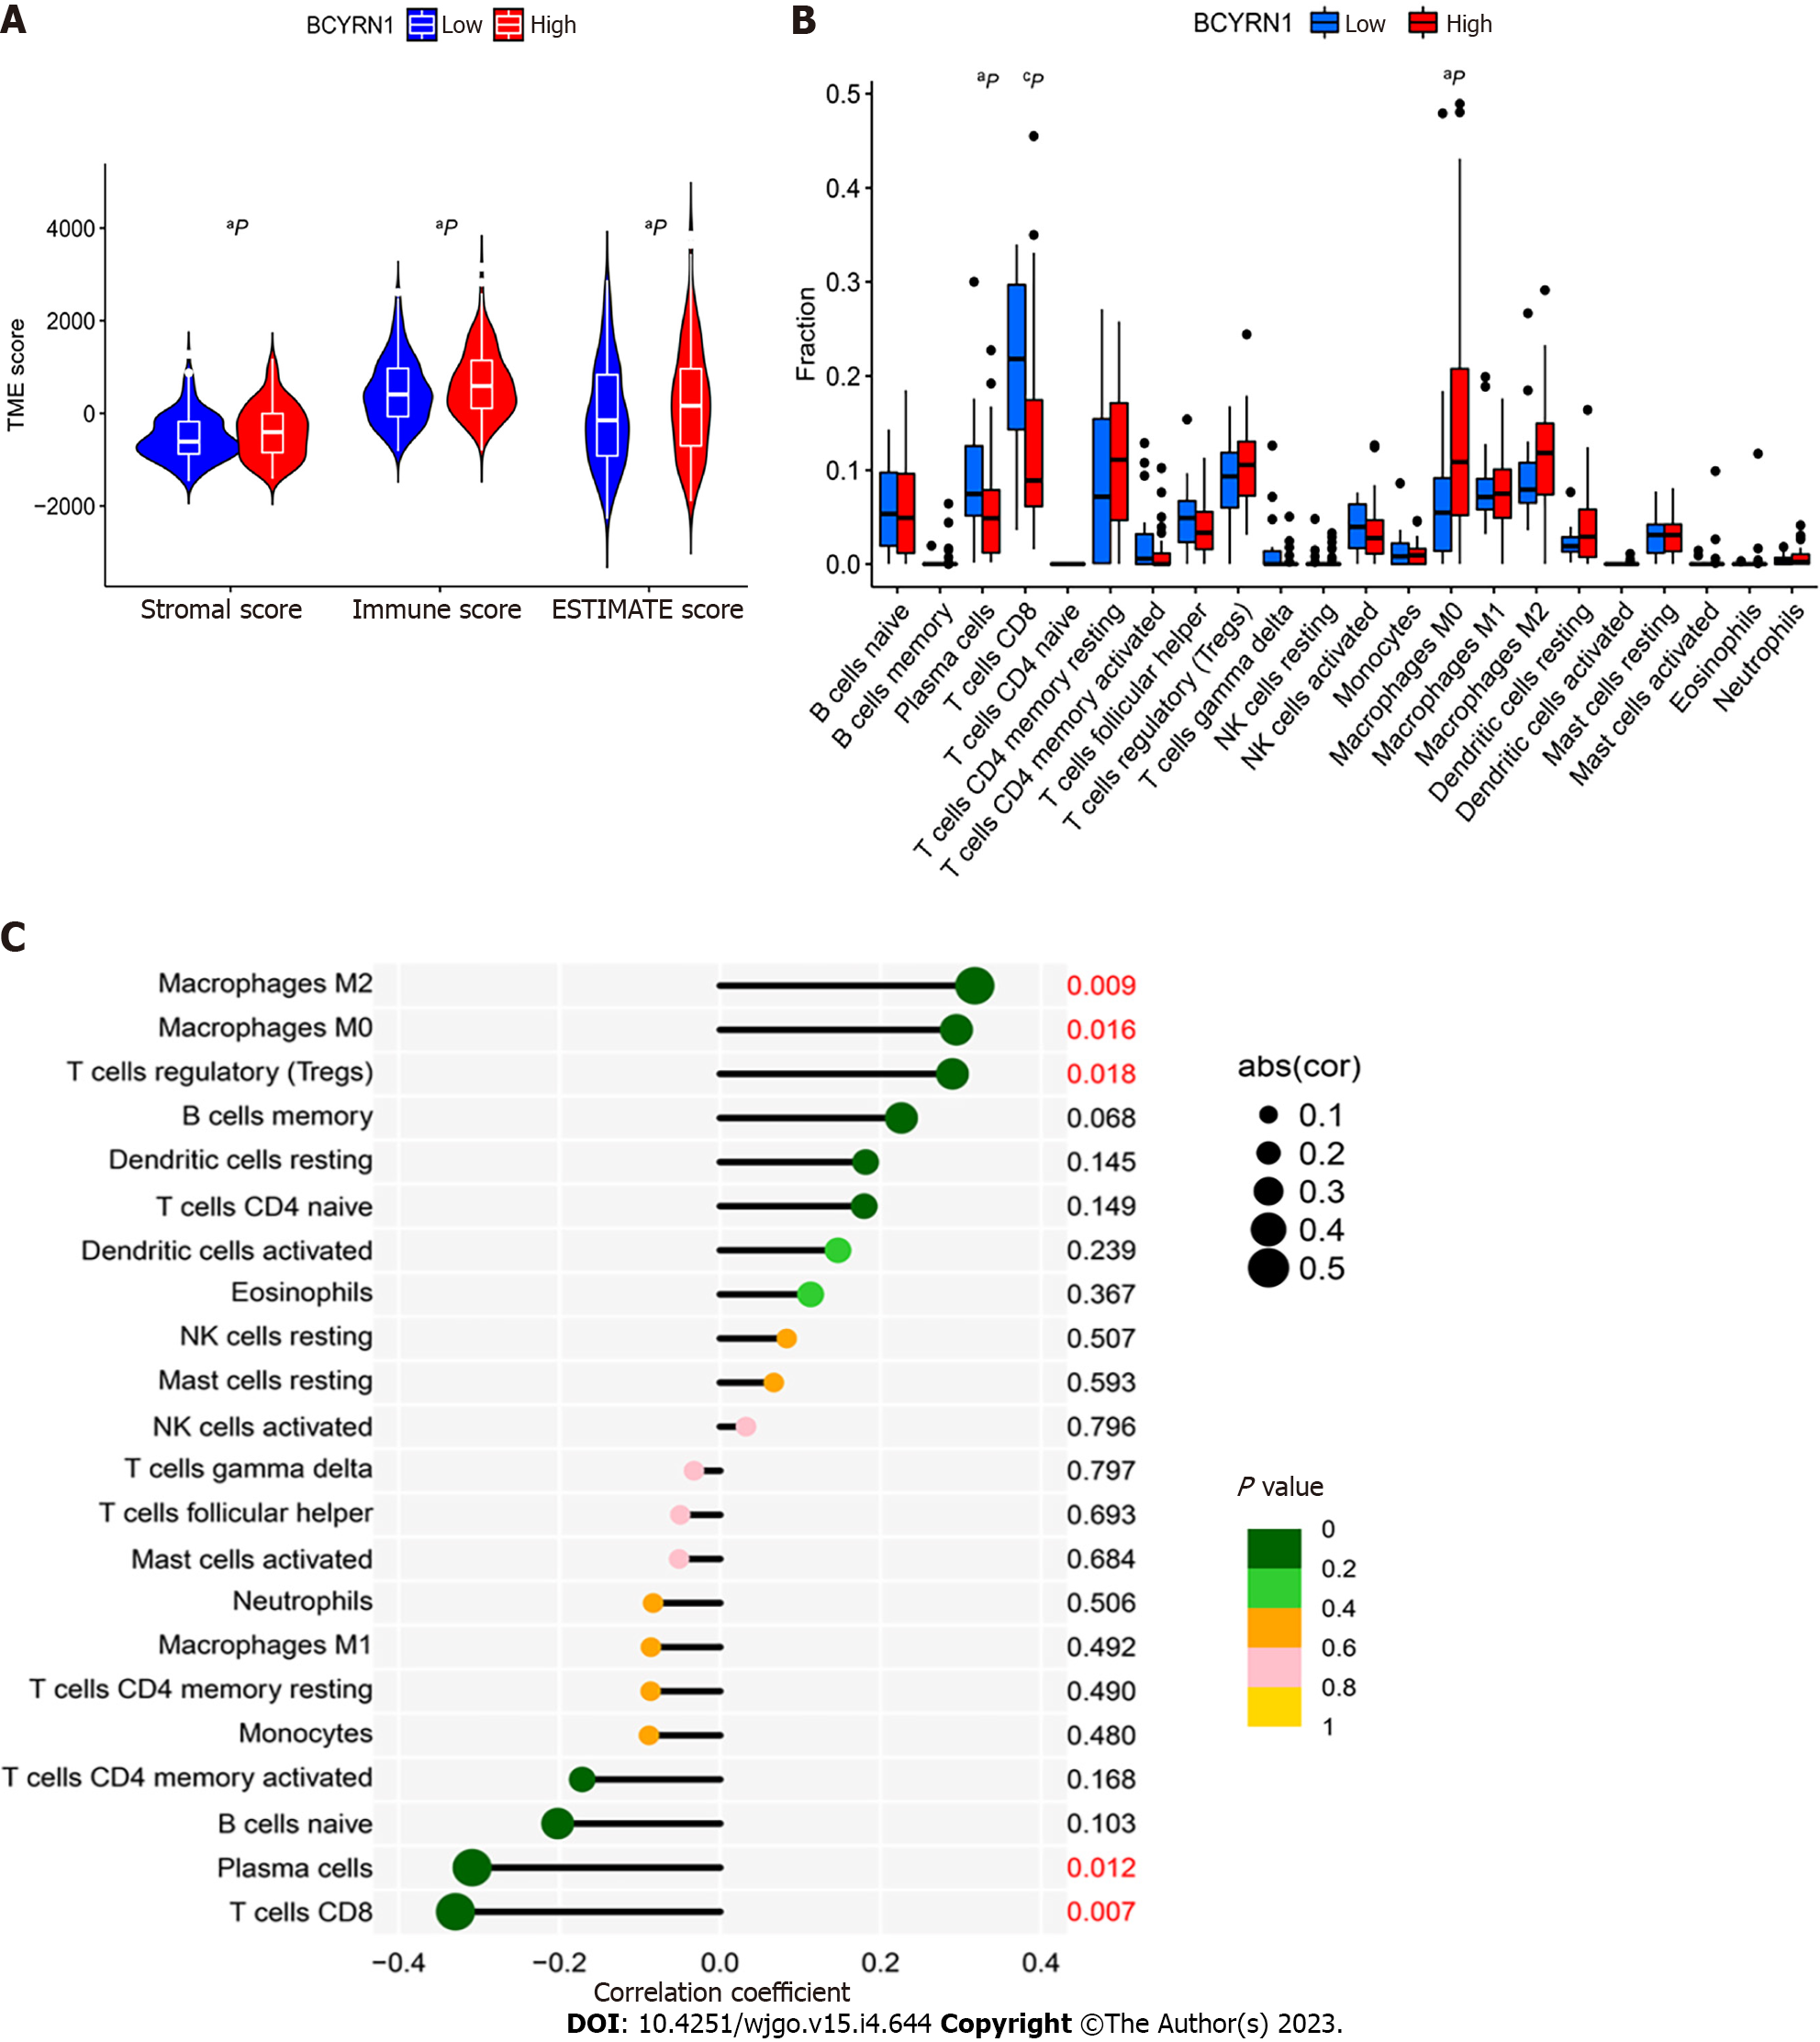
Figure 7 Correlation analysis and differential analysis of brain cytoplasmic RNA1 expression with tumor microenvironment and immune cell infiltration in hepatocellular carcinoma.
A: Violin plot of the difference in tumor microenvironment scores between the high and low brain cytoplasmic RNA1 (BCYRN1) expression groups; B: Box plots of differential analysis between the infiltration levels of 22 immune cells and the high and low expression groups of BCYRN1; C: Lollipop plot of correlation analysis between expression of BCYRN1 and levels of 22 immune cell infiltrates. aP < 0.05, bP < 0.01, cP < 0.001.
- Citation: Han XY, Li X, Zhao RY, Ma HZ, Yu M, Niu XD, Jin HJ, Wang YF, Liu DM, Cai H. Comprehensive analysis of prognostic value and immunotherapy prospect of brain cytoplasmic RNA1 in hepatocellular carcinoma. World J Gastrointest Oncol 2023; 15(4): 644-664
- URL: https://www.wjgnet.com/1948-5204/full/v15/i4/644.htm
- DOI: https://dx.doi.org/10.4251/wjgo.v15.i4.644


