Copyright
©The Author(s) 2023.
World J Gastrointest Oncol. Apr 15, 2023; 15(4): 644-664
Published online Apr 15, 2023. doi: 10.4251/wjgo.v15.i4.644
Published online Apr 15, 2023. doi: 10.4251/wjgo.v15.i4.644
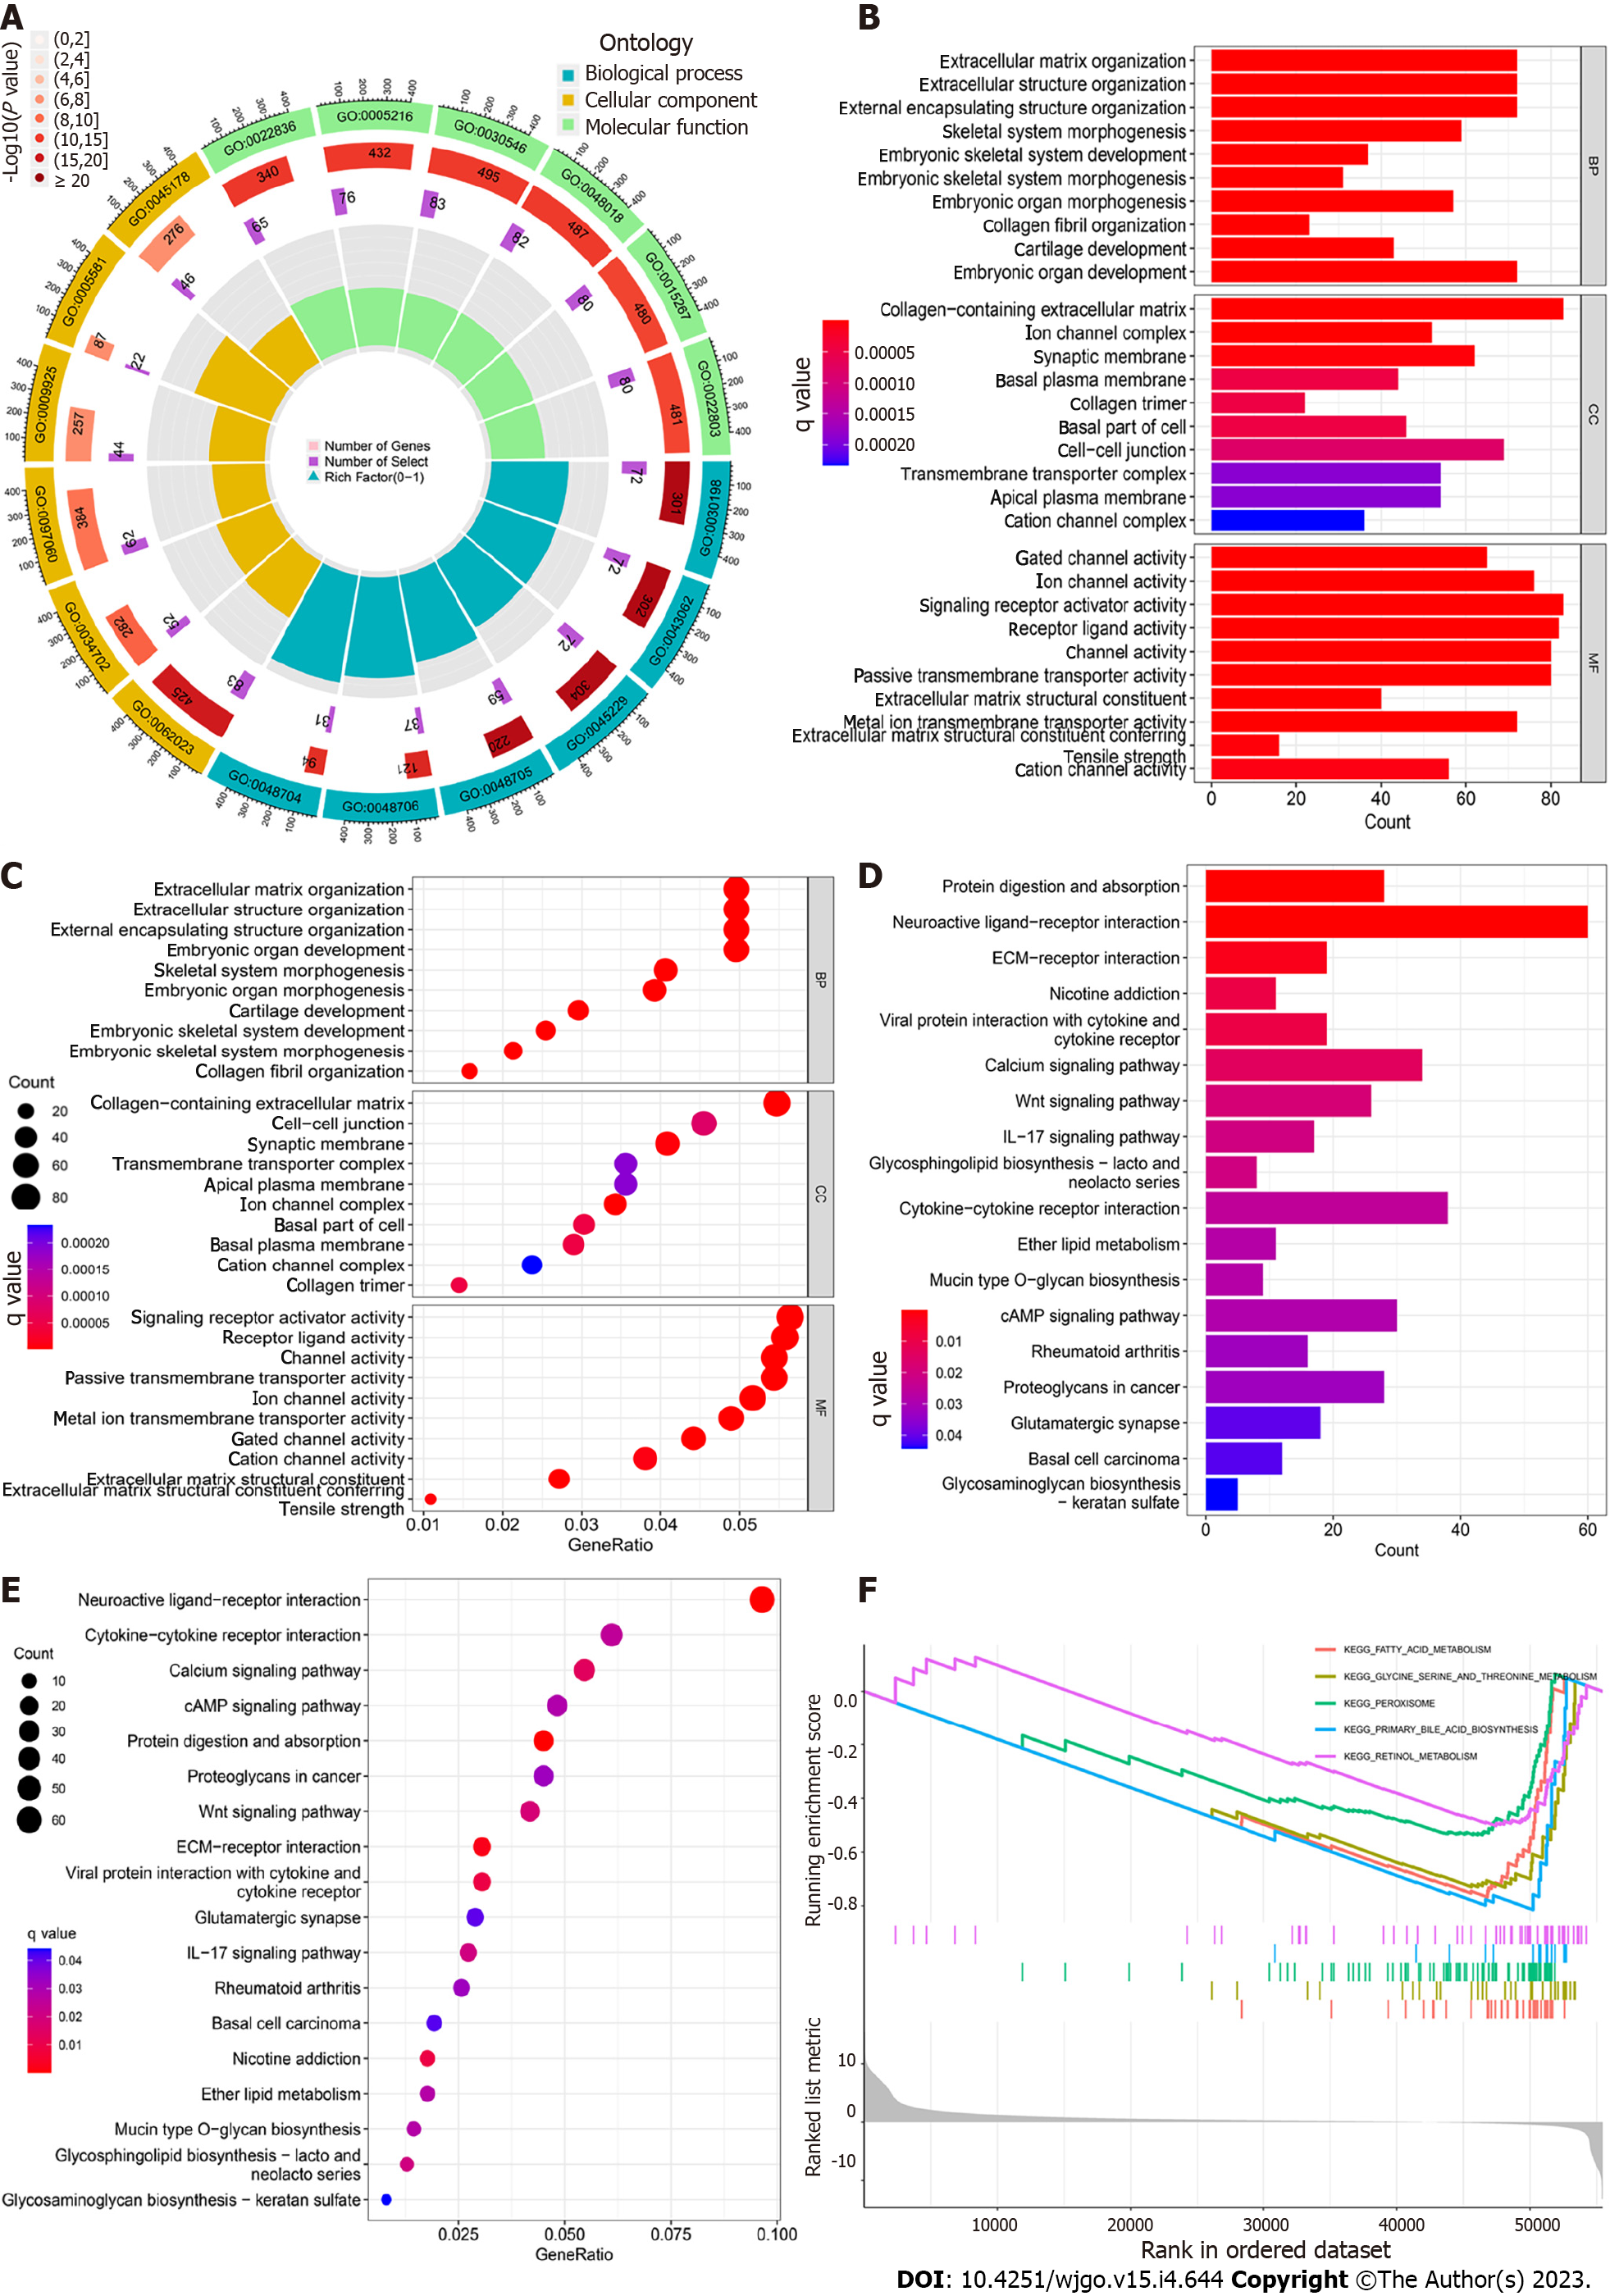
Figure 6 Enrichment analysis of brain cytoplasmic RNA1-associated differentially expressed genes.
A: Circle diagram of gene ontology (GO) enrichment analysis in biomolecular function, biological process and cellular component; B: Histogram of GO enrichment analysis; C: Bubble plots for GO enrichment analysis; D: Histogram of Kyoto Encyclopedia of Genes and Genomes (KEGG) enrichment analysis showed the top 20 pathways with the most significant correlation; E: Bubble plots for KEGG enrichment analysis; F: Brain cytoplasmic RNA1-associated Gene Set Enrichment Analysis.
- Citation: Han XY, Li X, Zhao RY, Ma HZ, Yu M, Niu XD, Jin HJ, Wang YF, Liu DM, Cai H. Comprehensive analysis of prognostic value and immunotherapy prospect of brain cytoplasmic RNA1 in hepatocellular carcinoma. World J Gastrointest Oncol 2023; 15(4): 644-664
- URL: https://www.wjgnet.com/1948-5204/full/v15/i4/644.htm
- DOI: https://dx.doi.org/10.4251/wjgo.v15.i4.644


