Copyright
©The Author(s) 2023.
World J Gastrointest Oncol. Apr 15, 2023; 15(4): 644-664
Published online Apr 15, 2023. doi: 10.4251/wjgo.v15.i4.644
Published online Apr 15, 2023. doi: 10.4251/wjgo.v15.i4.644
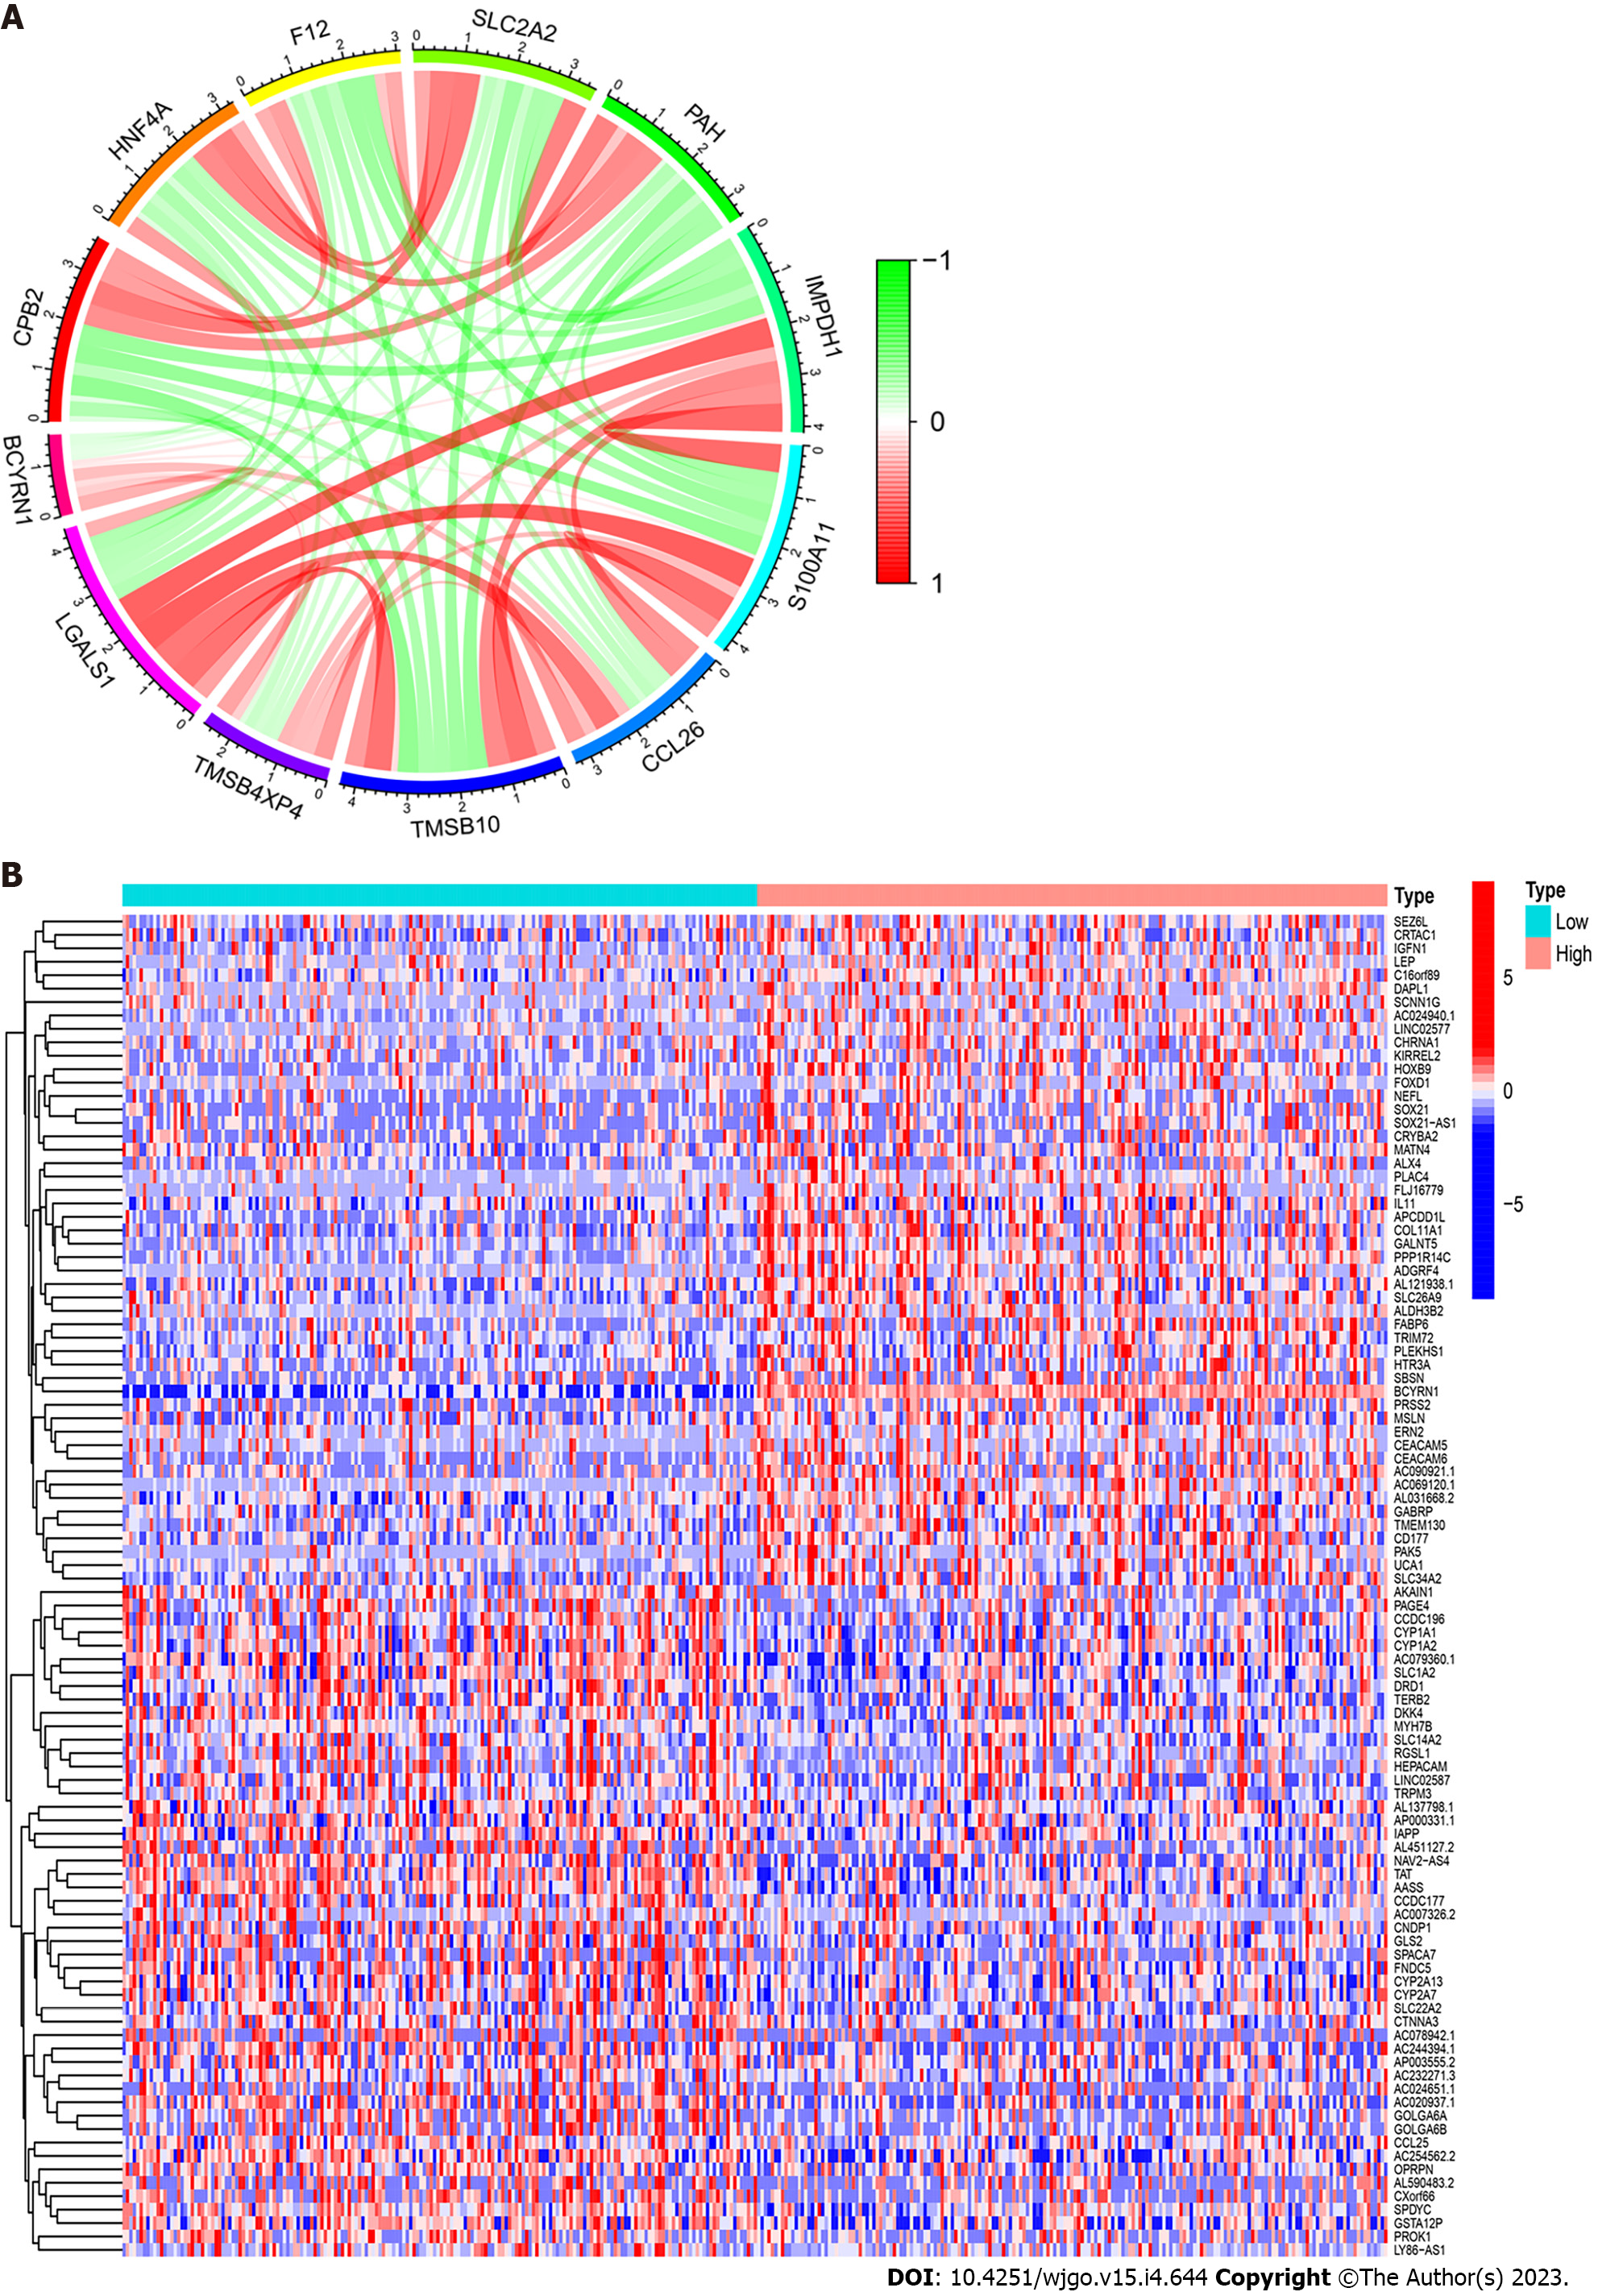
Figure 5 Co-expressed and differential genes of brain cytoplasmic RNA1 in hepatocellular carcinoma.
A: Co-expression circle plot of 11 genes most closely related to brain cytoplasmic RNA1 (BCYRN1) in hepatocellular carcinoma (HCC). Red represented significant positive correlation, green represented significant negative correlation, and shade represented the magnitude of correlation; B: Heat map of differentially expressed genes of BCYRN1 in HCC. Red represented upregulation and blue represented downregulation. Light blue represented the low expression group of BCYRN1, and light red represented the high expression group of BCYRN1.
- Citation: Han XY, Li X, Zhao RY, Ma HZ, Yu M, Niu XD, Jin HJ, Wang YF, Liu DM, Cai H. Comprehensive analysis of prognostic value and immunotherapy prospect of brain cytoplasmic RNA1 in hepatocellular carcinoma. World J Gastrointest Oncol 2023; 15(4): 644-664
- URL: https://www.wjgnet.com/1948-5204/full/v15/i4/644.htm
- DOI: https://dx.doi.org/10.4251/wjgo.v15.i4.644


