Copyright
©The Author(s) 2023.
World J Gastrointest Oncol. Mar 15, 2023; 15(3): 546-561
Published online Mar 15, 2023. doi: 10.4251/wjgo.v15.i3.546
Published online Mar 15, 2023. doi: 10.4251/wjgo.v15.i3.546
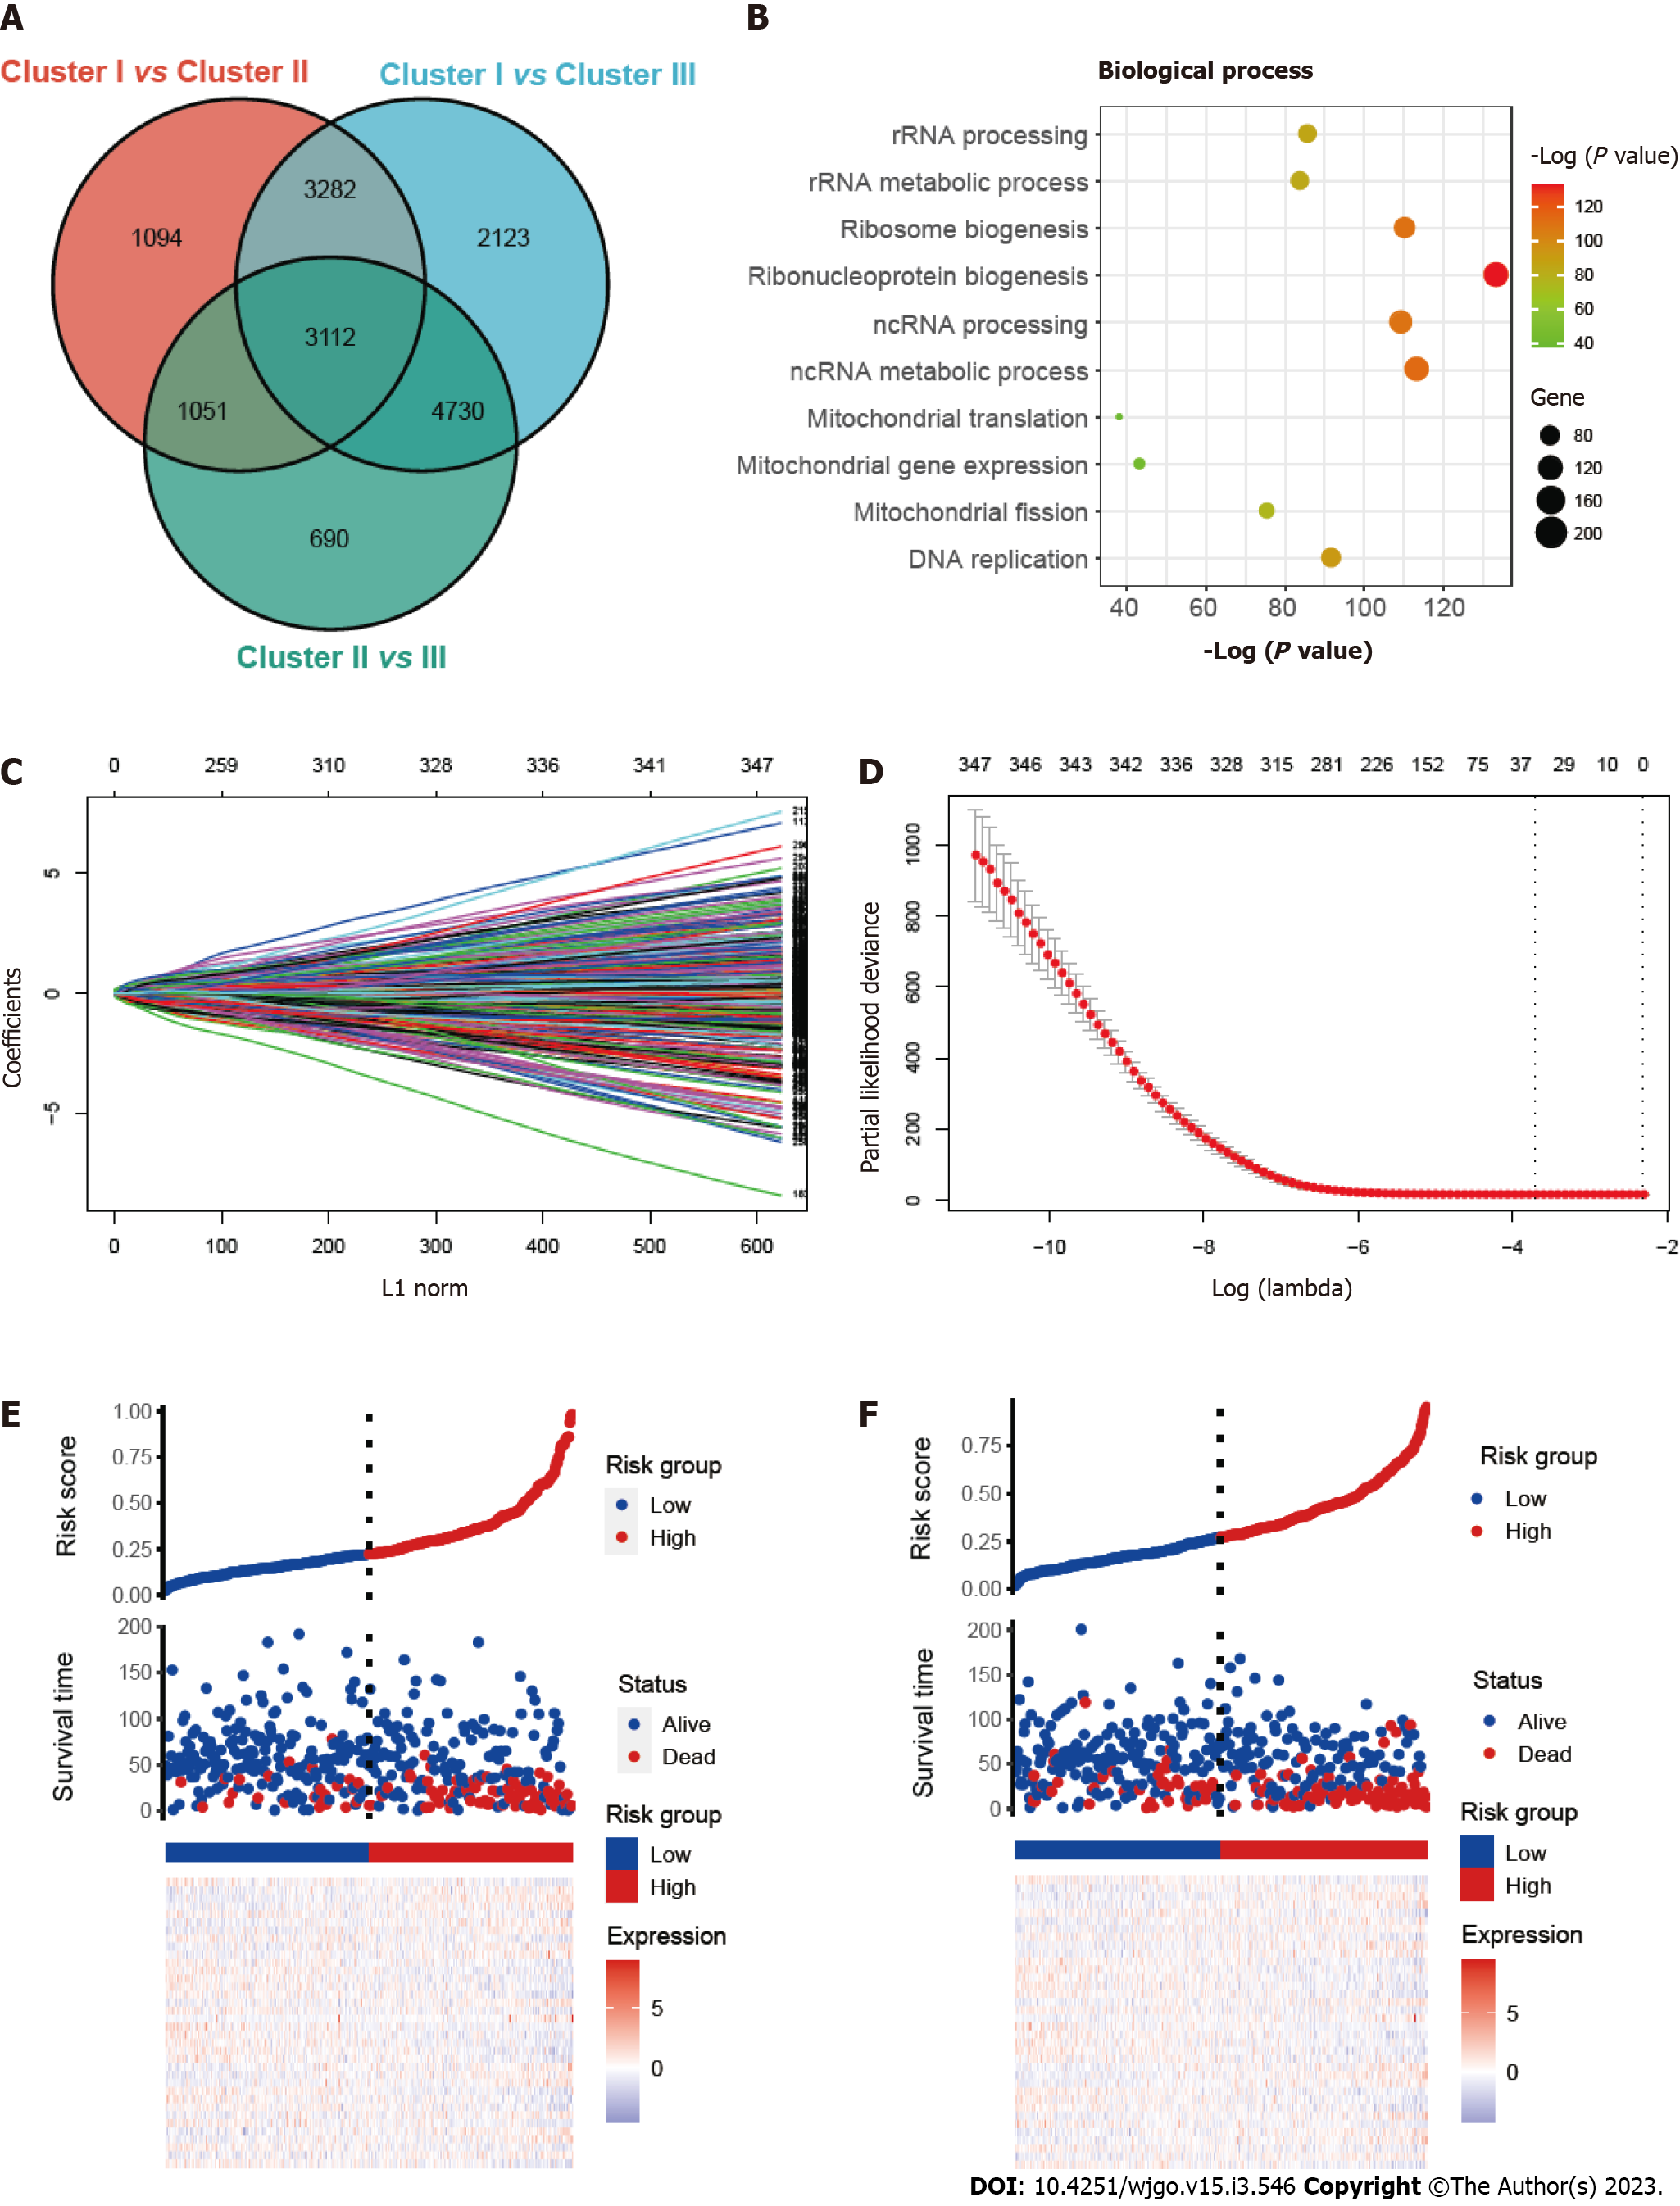
Figure 3 Construction and validation of the prognostic risk_score.
A: Venn diagram showing overlapped genes between the three clusters; B: Gene ontology enrichment (GO) analysis of mitophagy-related genes; C and D: Thirty-six candidate genes screened out by least absolute shrinkage and selection operator method analysis with minimal lambda; E and F: Ranked dot and scatter plots showing risk_score distribution, patient survival status, survival time and expression of 36 mitophagy-related genes in training set and validation set.
- Citation: Weng JS, Huang JP, Yu W, Xiao J, Lin F, Lin KN, Zang WD, Ye Y, Lin JP. Mitophagy-related gene signature predicts prognosis, immune infiltration and chemotherapy sensitivity in colorectal cancer. World J Gastrointest Oncol 2023; 15(3): 546-561
- URL: https://www.wjgnet.com/1948-5204/full/v15/i3/546.htm
- DOI: https://dx.doi.org/10.4251/wjgo.v15.i3.546


