Copyright
©The Author(s) 2023.
World J Gastrointest Oncol. Mar 15, 2023; 15(3): 533-545
Published online Mar 15, 2023. doi: 10.4251/wjgo.v15.i3.533
Published online Mar 15, 2023. doi: 10.4251/wjgo.v15.i3.533
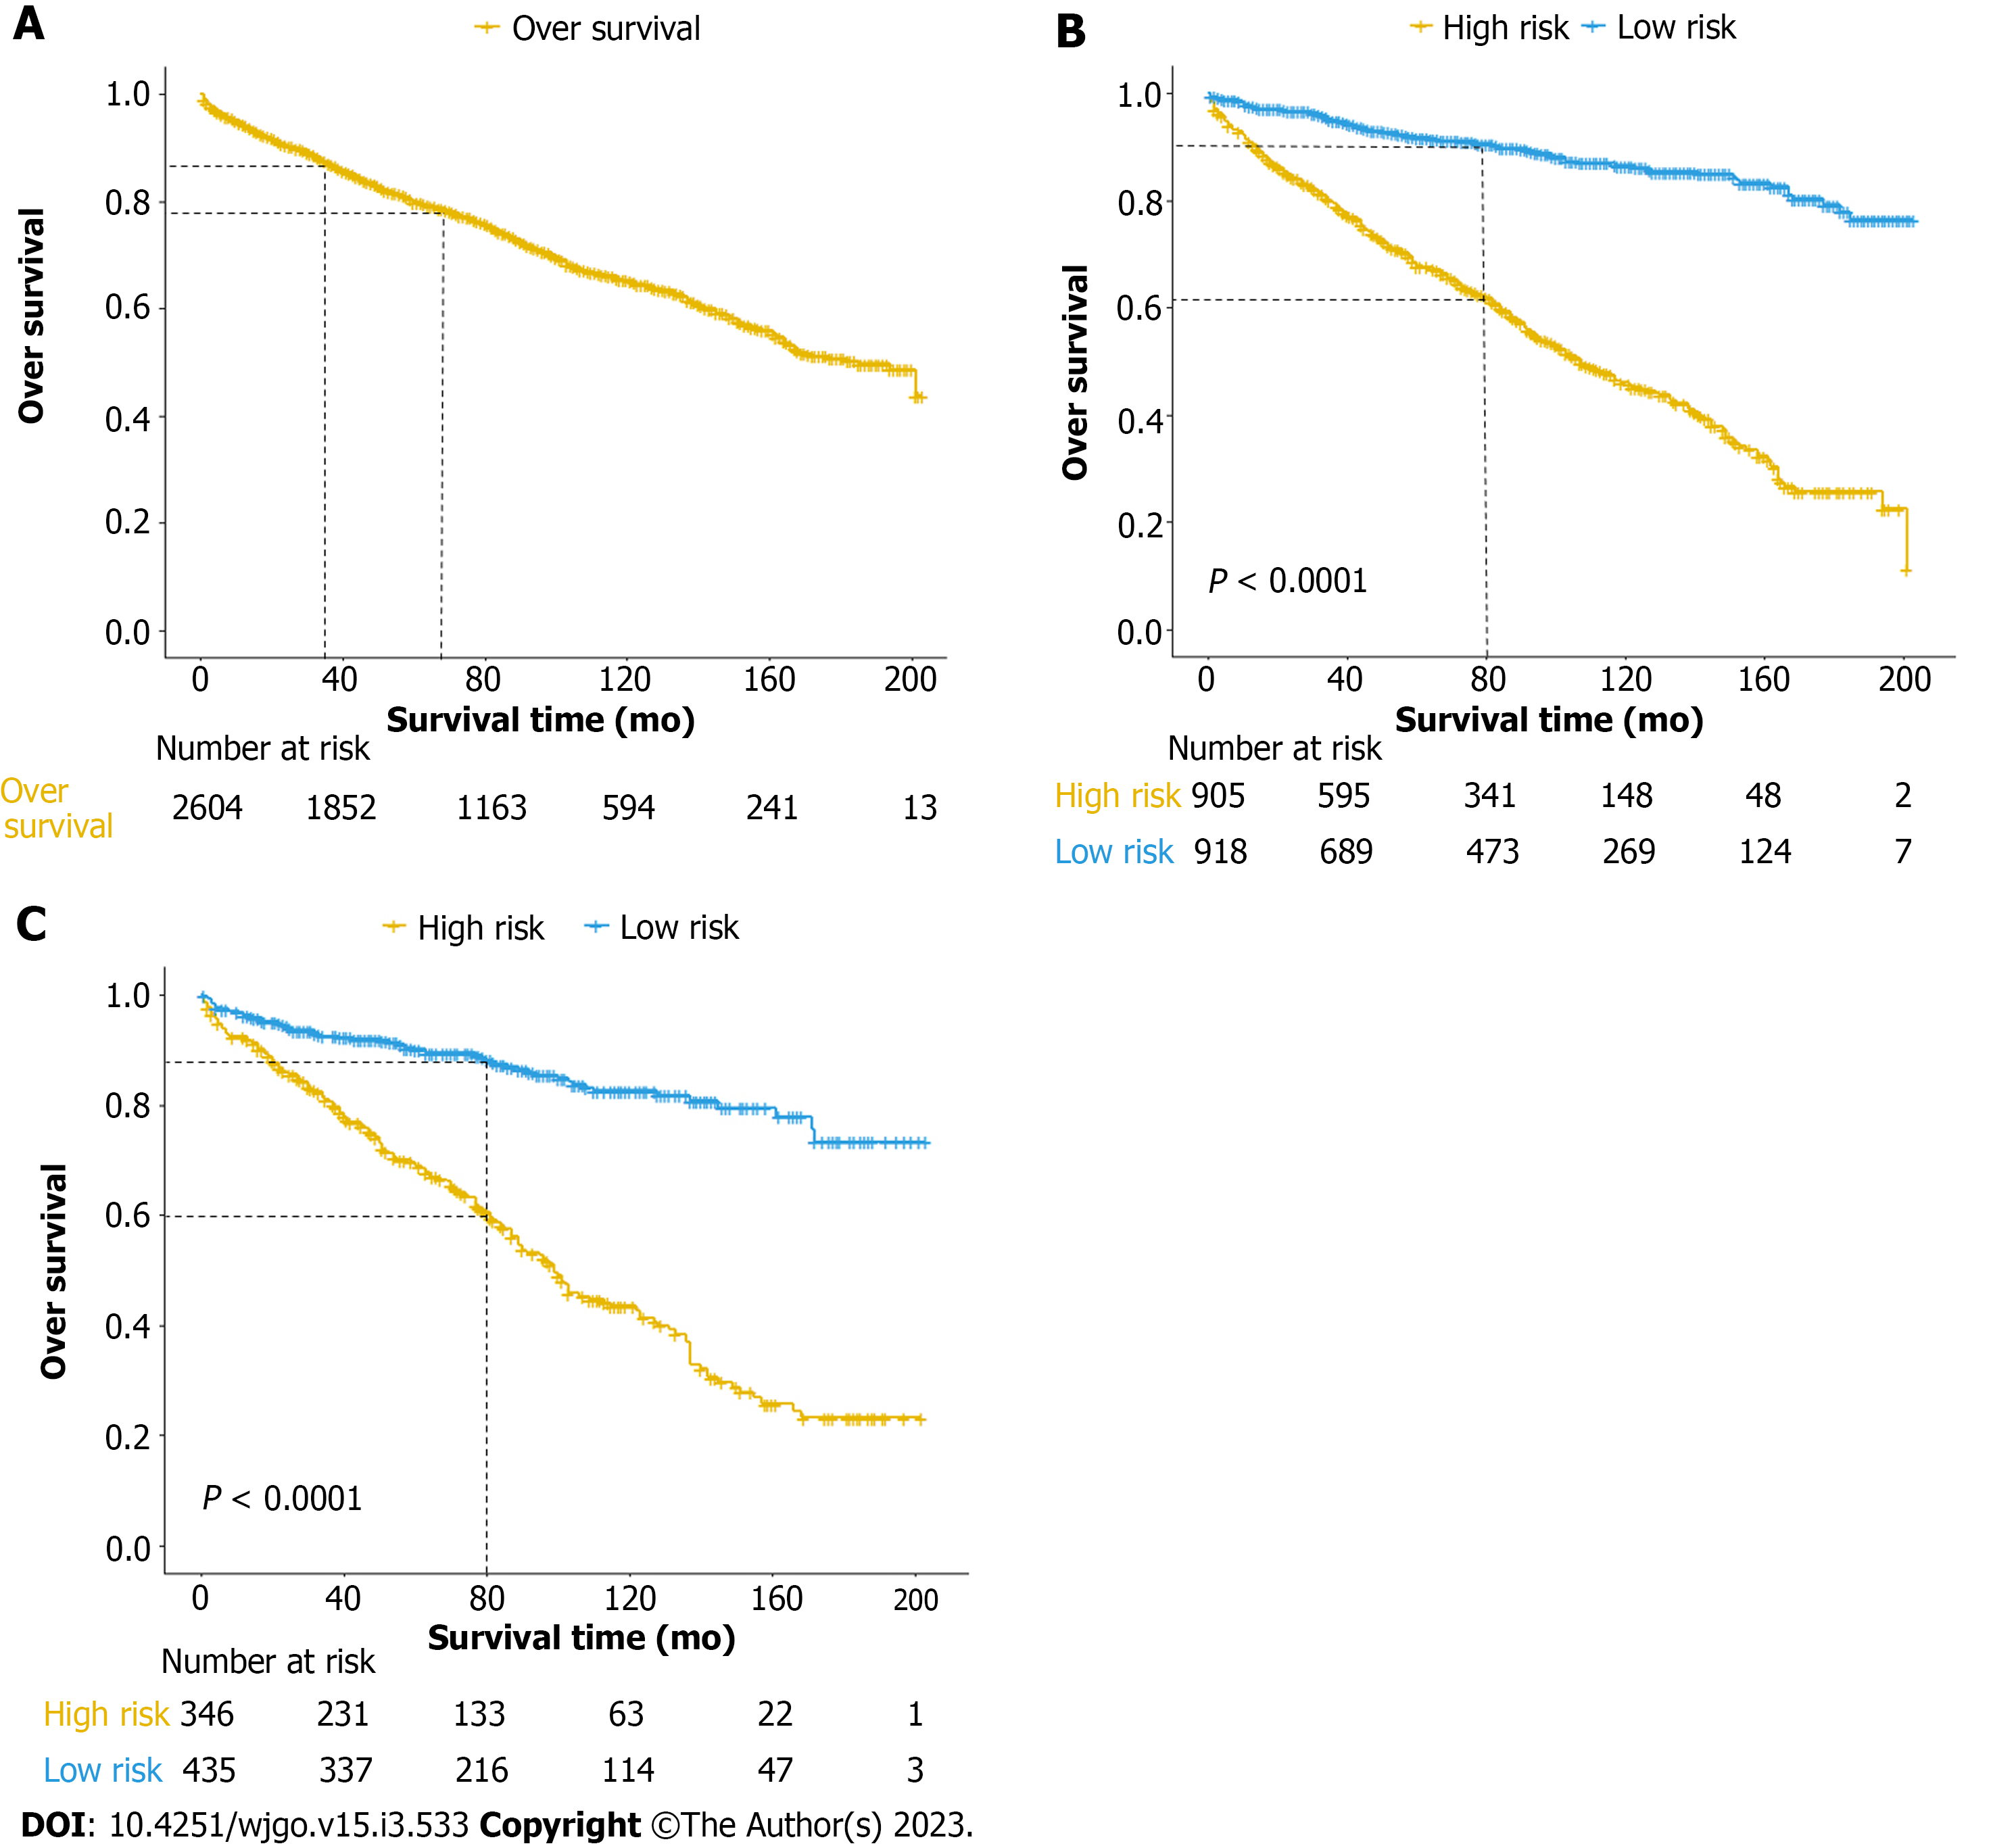
Figure 4 Kaplan–Meier curves of overall survival for patients in the high- and low-risk groups.
A-C: Analysis results of all patients (A), the training set (B), and the testing set (C). OS: Overall survival.
- Citation: Wang D, Shi XL, Xu W, Shi RH. Nomogram model predicting the overall survival for patients with primary gastric mucosa-associated lymphoid tissue lymphoma. World J Gastrointest Oncol 2023; 15(3): 533-545
- URL: https://www.wjgnet.com/1948-5204/full/v15/i3/533.htm
- DOI: https://dx.doi.org/10.4251/wjgo.v15.i3.533


