Copyright
©The Author(s) 2023.
World J Gastrointest Oncol. Mar 15, 2023; 15(3): 372-388
Published online Mar 15, 2023. doi: 10.4251/wjgo.v15.i3.372
Published online Mar 15, 2023. doi: 10.4251/wjgo.v15.i3.372
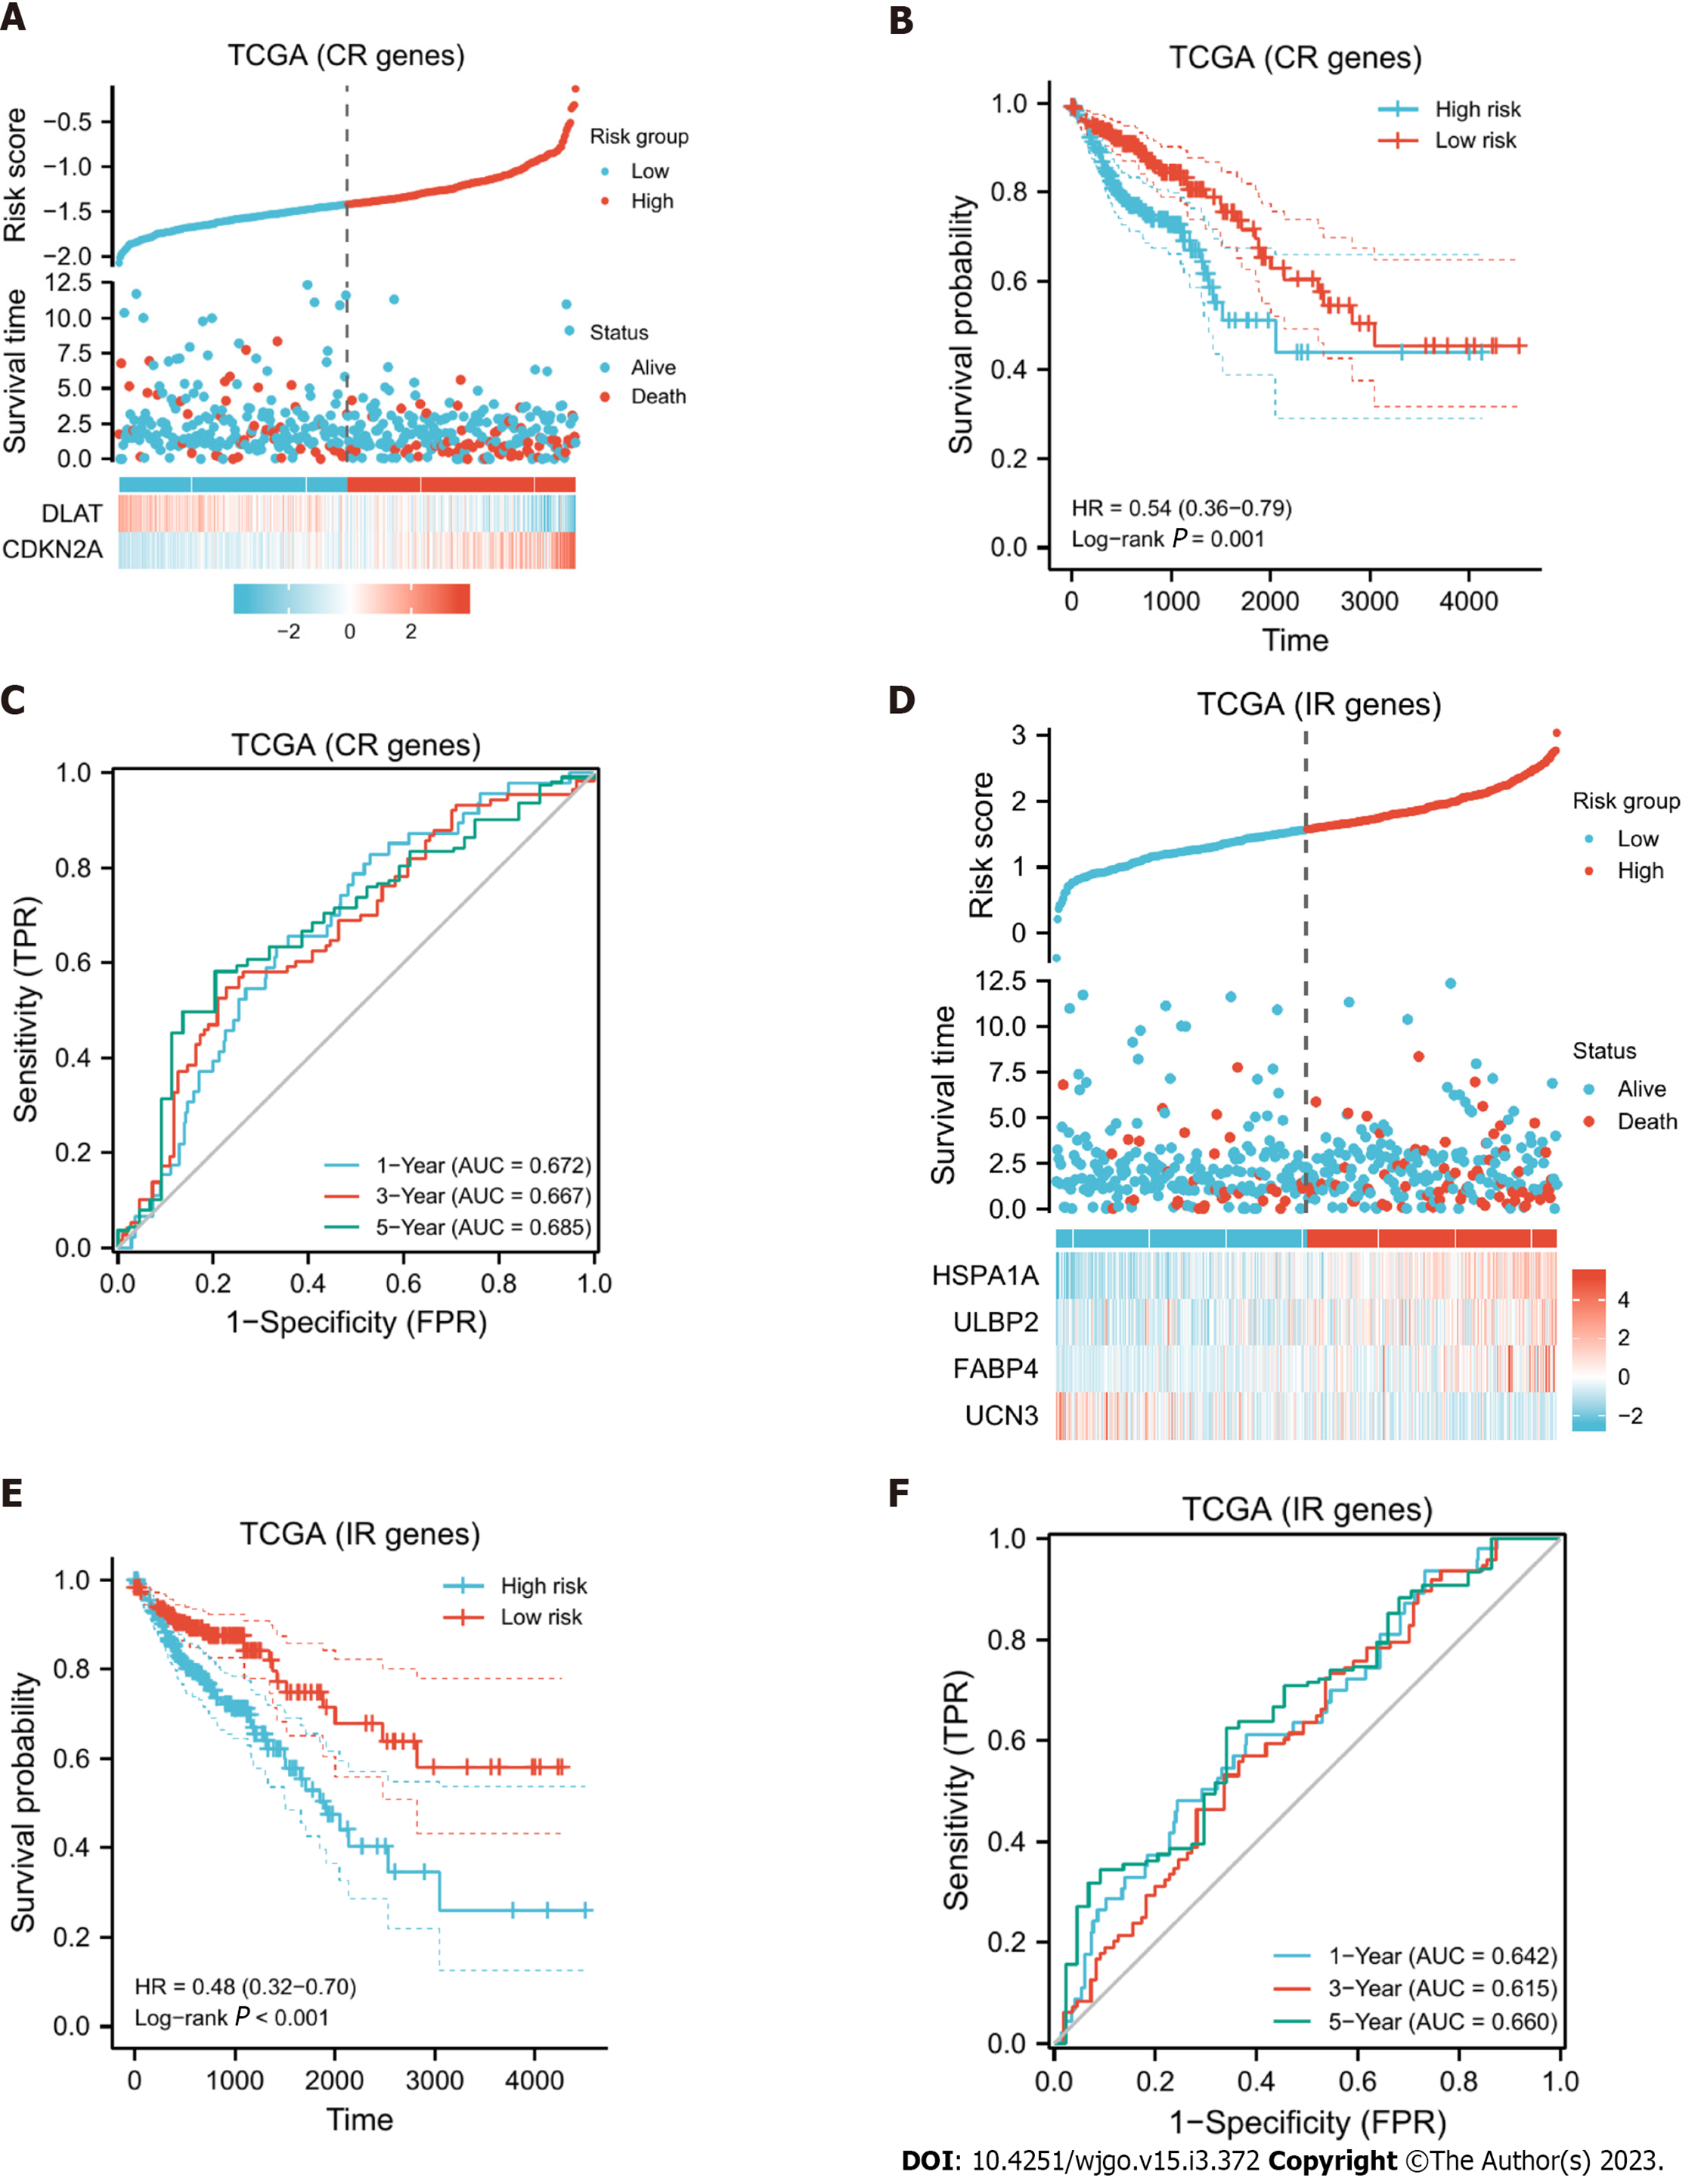
Figure 4 Model evaluation.
A: Expression differences of DLAT and CDKN2A in high- and low-risk groups and the risk scores and survival time of different subgroups are shown; B: KM curve of the cuproptosis-related (CR) model. The higher the CR risk score was, the worse the prognosis. In the figure, high-risk group was taken as the control group, so the low-risk score is a protective factor with the HR < 1; C: Receiver operating characteristic (ROC) curve of the CR model, and the size of the area under the curve can reveal the quality of the model. In the figure, the area under the curve (AUC) values in years 1, 3, and 5 are all greater than 0.6, indicating that the model has strong predictive ability; D: Expression differences of the four immune-related (IR) differentially expressed genes used to construct the model in the high- and low-risk groups and the risk scores and survival times of different subgroups are shown; E: KM curve of the IR model; the higher the risk score was, the worse the prognosis; F: ROC curve of the IR model, and its AUC values at 1, 3, and 5 years were all greater than 0.6. TCGA: The Cancer Genome Atlas database.
- Citation: Huang YY, Bao TY, Huang XQ, Lan QW, Huang ZM, Chen YH, Hu ZD, Guo XG. Machine learning algorithm to construct cuproptosis- and immune-related prognosis prediction model for colon cancer. World J Gastrointest Oncol 2023; 15(3): 372-388
- URL: https://www.wjgnet.com/1948-5204/full/v15/i3/372.htm
- DOI: https://dx.doi.org/10.4251/wjgo.v15.i3.372


